
Higher November 2020 Paper 3 Q19
19 The sketch shows the lines \(\quad x = 1 \quad\) and \(\quad y = -3\)
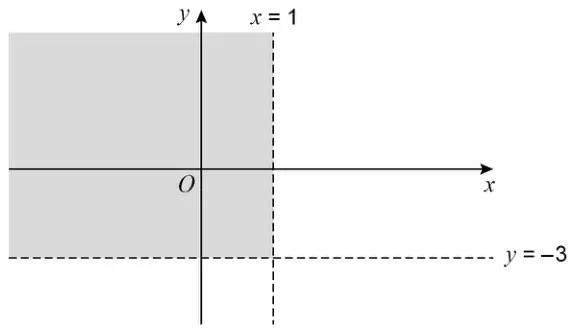
Which pair of inequalities describes the shaded region?
Tick one box. [1 mark]
- \(x < 1\) and \(y < -3\)
- \(x < 1\) and \(y > -3\)
- \(x > 1\) and \(y > -3\)
- \(x > 1\) and \(y < -3\)
| Answer | Mark | Comments |
|---|---|---|
| \(x < 1\) and \(y > -3\) | B1 |