
Higher November 2017 Paper 3 Q23
23 Joe draws this graph to identify the region R represented by
\(y \leqslant x + 2 \quad\) and \(\quad y \gt 3 - x \quad\) and \(\quad x \lt 3\)
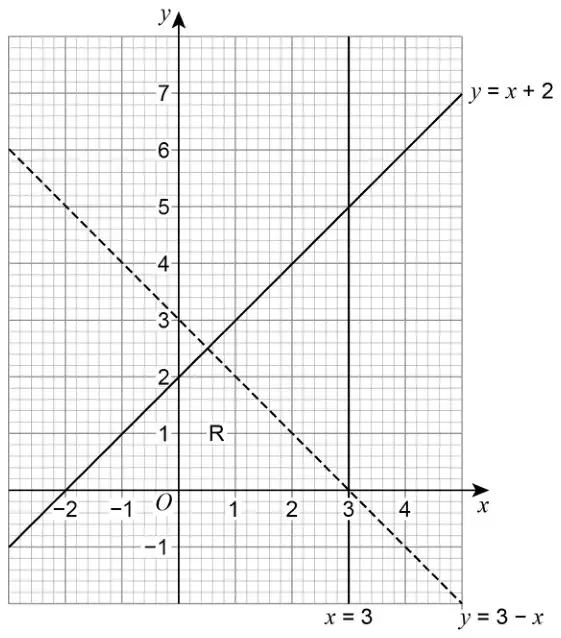
Make two criticisms of his graph. [2 marks]
| Answer | Mark | Comments |
|---|---|---|
| Line \(x = 3\) should be dashed or not included | B1 | oe eg vertical line should be dotted |
| R is in the wrong place | B1 | oe eg region is not correct May be shown on diagram |
Additional guidance
| \(x\) is not equal to 3 | B1 |
| R does not include \(x = 3\) | B1 |
| Straight line should be less than 3 | B1 |
| \(x = 3\) is not in the region | B1 |
| Line at \(x = 3\) is closed not open | B1 |
| Lines are not drawn correctly (not enough) | B0 |
| Should have shaded above the dotted line (\(y \gt 3 - x\)) | B1 |
| R should be where (2, 2) is | B1 |
| R should be shaded | B0 |