
June 2019 Paper 3 Q16
16
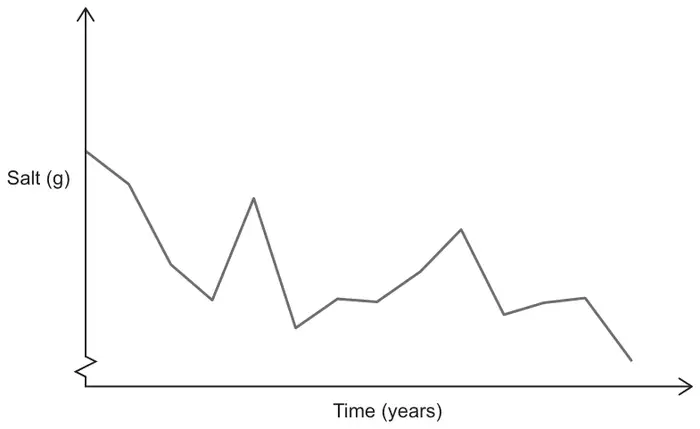
Meera and Gemma are arguing about what this graph shows.
Meera believes that the amount of salt consumed by people decreased greatly during this period.
Gemma says that this is not the case.
Using your knowledge of the Large Data Set, give two reasons why Gemma may be correct. [2 marks]
In 2018, a sample of 918 people had a mean of 80.4 grams of sugar purchased per person.
Investigate, at the 5% level of significance, whether the mean amount of sugar purchased per person in England has changed between 2014 and 2018.
Assume that the survey data is a random sample taken from a normal distribution and that the standard deviation has remained the same. [6 marks]
At the 10% significance level, the null hypothesis is rejected.
With reference to the 10% significance level, explain why it is not necessarily true that there has been a change. [2 marks]
| Scheme | Marks | AO |
|---|---|---|
| States correct first reason involving the \(y\)-axis Accept there is no scale on the \(y\)-axis or graph does not start at 0 | E1 | 2.3 |
| States correct second reason involving salt purchased and consumed implying data not comparable | E1 | 2.3 |
Typical solution
Scale on \(y\)-axis does not start at zero.
Data is for salt purchased as separate food stuff, not consumed
| Scheme | Marks | AO |
|---|---|---|
| States both hypotheses correctly for two-tailed test Accept \(\mathrm{H}_0\): population mean is 78.9 | B1 | 2.5 |
| Formulates the test statistic or uses the correct distribution of the sample mean PI by correct test statistic value or probability or acceptance region Condone \(78.9 - 80.4\) If region used, condone any \(z = (-4, 4)\) | M1 | 1.1a |
| Obtains the correct value of the test statistic 1.82 or obtains the correct probability 0.0345 or 0.0691 obtains acceptance region of [77.3, 80.5] | A1 | 1.1b |
| Compares their 1.82 with 1.96 or compares their 0.0345 with 0.025 compares their 0.0691 with 0.05 or compares 80.4 with their region [77.3, 80.5] | M1 | 1.1a |
| Infers \(\mathrm{H}_0\) accepted CSO Must refer to \(\mathrm{H}_0\) | A1 | 2.2b |
| Correctly concludes in context that there is insufficient evidence to suggest that the mean amount of sugar purchased has changed CSO | E1 | 3.2a |
Typical solution
\[\mathrm{H}_0: \mu = 78.9\]\[\mathrm{H}_1: \mu \neq 78.9\]\[\text{Test statistic} = \frac{80.4 - 78.9}{25.0 / \sqrt{918}} = 1.82\]Critical \(z\) value 1.96
\[1.82 \lt 1.96\]Accept \(\mathrm{H}_0\) - there is insufficient evidence to suggest that the mean amount of sugar purchased has changed
| Scheme | Marks | AO |
|---|---|---|
| Explains role of significance level in rejecting null hypothesis in error Accept Type I error | E1 | 2.3 |
| Explains that there is 10% chance for this to occur Reference to 10% chance the conclusion is incorrect scores E0E1 | E1 | 2.3 |
| (10 marks) |
Typical solution
There is a 10% chance of rejecting null hypothesis in error