
June 2020 Paper 3 Q12
12 The box plot below summarises the CO2 emissions, in g/km, for cars in the Large Data Set from the London and North West regions.
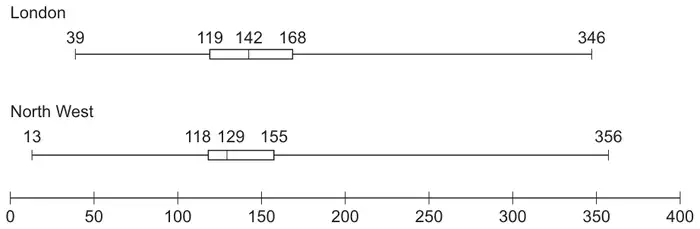
(a) Using the box plot, give one comparison of central tendency and one comparison of spread for the two regions. [2 marks]
(b) Jaspal, an environmental researcher, used all of the data in the Large Data Set to produce a statistical comparison of the CO2 and CO emissions in regions of England.
Using your knowledge of the Large Data Set, give two reasons why his conclusions may be invalid. [2 marks]
| Scheme | Marks | AO |
|---|---|---|
| Compares correctly the medians and infers that London is greater Must use median only References to values (London 142 and North West 129), if used, must be correct | E1 | 2.2b |
| Compares correctly the ranges and infers that London is less or compares correctly the IQR/SIQR and infers that London’s IQR/SIQR is greater Must use range/IQR/SIQR only References to values, range (London 307 and North West 343) /IQR (London 49 and North West 37) /SIQR (London 24.5 and North West 18.5) if used, must be correct | E1 | 2.2b |
| (2) |
Typical solution
Central tendency
Median in London is greater than the median in the North West
Spread
Range in London is less than the range in the North West
Notes
The SIQR values are London 24.5 and North West 18.5 (corrected from the printed mark scheme, which gives 143.5 and 136.5: these are the midpoints of the quartiles, not the semi-interquartile ranges).
| Scheme | Marks | AO |
|---|---|---|
| Gives one reason why his conclusion may be invalid | E1 | 2.4 |
| Gives a second reason why his conclusion may be invalid Other reasons Some values for CO2 or CO are missing in the LDS LDS has outliers/skewed LDS uses CO2 or CO from cars only LDS on shows data for cars registered in 2002 and 2016 Values in the LDS were not exact or have been rounded Information not representative of England OE | E1 | 2.4 |
| (2) | ||
| (4 marks) |
Typical solution
Not all makes of car are included in the database
Not all English regions are included