June 2020 Paper 3 Q6
6 The graph of \(y = \mathrm{f}(x)\) is shown below.
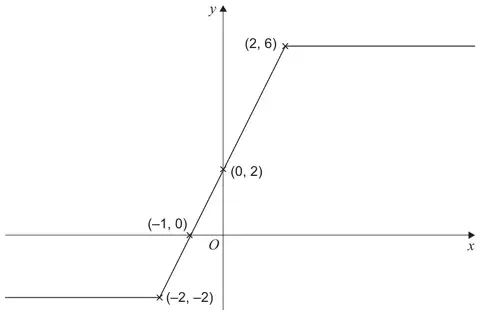
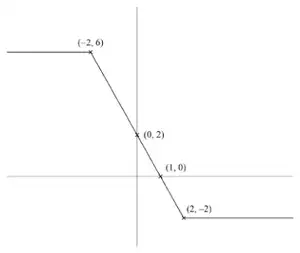
(a) Sketch the graph of \(y = \mathrm{f}(-x)\) [2 marks]
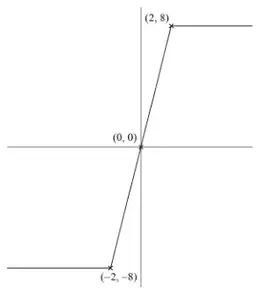
(b) Sketch the graph of \(y = 2\mathrm{f}(x) - 4\) [2 marks]
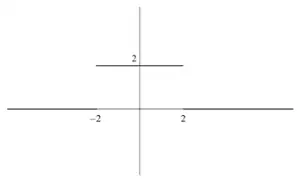
(c) Sketch the graph of \(y = \mathrm{f}^{\prime}(x)\) [3 marks]
| Scheme | Marks | AO |
|---|---|---|
| Sketches correct shape with graph reflected in the \(y\)-axis | M1 | 1.1a |
| Labels all four points correctly Condone omission of (0, 2) | A1 | 1.1b |
| (2) |
Typical solution
| Scheme | Marks | AO |
|---|---|---|
| Calculates or labels at least two points of (2, 8), (0, 0), (−1, −4) or (−2, −8) correctly | M1 | 3.1a |
| Sketches correct graph and labels all four points correctly Condone omission of (0,0) or (−1, −4) or both | A1 | 1.1b |
| (2) |
Typical solution
| Scheme | Marks | AO |
|---|---|---|
| Calculates or obtains gradient 2 for between \(x = -2\) and \(x = 2\) PI by line \(y = 2\) or calculates or obtains gradient 0 when \(x \lt -2\) or when \(x \gt 2\) PI by explaining gradient when \(x \lt -2\) or \(x \gt 2\) is zero or by drawing visible solid horizontal lines on the \(x\) axis | B1 | 1.1b |
| Draws a horizontal line on the positive \(y\)-axis between \(x = -2\) and \(x = 2\) without extension Ignore any other lines if drawn | M1 | 1.1a |
| Draws correct two solid horizontal lines on the \(x\)-axis up to \((-2, 0)\) and from \((2, 0)\) and their horizontal line \(y = 2\) between \(x = -2\) and \(x = 2\) Accept explanation that gradient for \(x \lt -2\) and \(x \gt 2\) is zero if no solid horizontal lines are drawn on the x-axis Do not accept solid vertical lines at \(x = -2\) or \(x = 2\) Follow through their value of positive gradient | A1F | 1.1b |
| (3) | ||
| (7 marks) |
Typical solution