
June 2020 Paper 2 Q15
15 A particle is moving in a straight line with velocity \(v\) m s−1 at time \(t\) seconds as shown by the graph below.
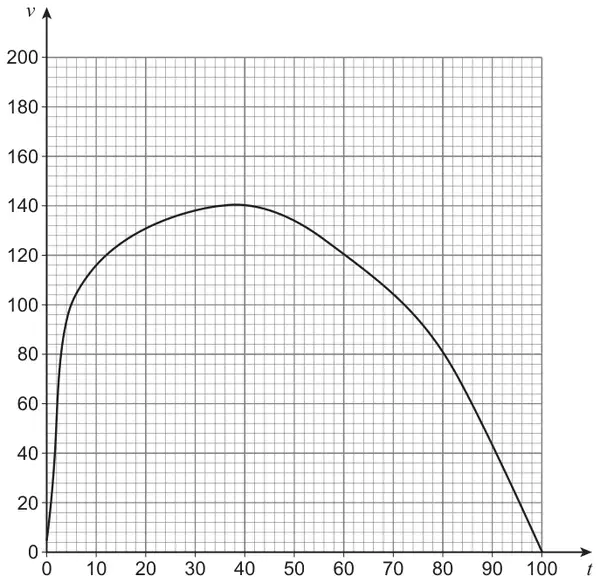
(a) Use the trapezium rule with four strips to estimate the distance travelled by the particle during the time period \(20 \leqslant t \leqslant 100\) [4 marks]
(b) Over the same time period, the curve can be very closely modelled by a particular quadratic.
Explain how you could find an alternative estimate using this quadratic. [1 mark]
| Scheme | Marks | AO |
|---|---|---|
| States strip width \(h = 20\) PI by correct y values and not contradicted. | B1 | 1.1b |
| States five \(y\) values PI \(y_0 = 131,\ y_1 = 140,\ y_2 = 120,\ y_3 = 80,\ y_4 = 0\) If they use h=25 condone \(y_0 = 6,\ y_1 = 135,\ y_2 = 134,\ y_3 = 94,\ y_4 = 0\) If they use five strips between \(20 \lt t \lt 100\) condone \(y_0 = 131,\ y_1 = 140,\ y_2 = 132,\ y_3 = 108,\ y_4 = 67,\ y_5 = 0\) Accept \(\pm 2\) on all y values | M1 | 1.1a |
| Applies correct trapezium rule formula to their values (this mark could be achieved with B0M0 so far) | M1 | 1.1a |
| Applies trapezium rule with four strips and obtains correct value for distance. (accept values between 7970m and less than 8250m) | A1 | 1.1a |
| (4) |
Typical solution
\[h = 20\]\[y_0 = 131,\ y_1 = 140,\ y_2 = 120,\ y_3 = 80,\ y_4 = 0\]\[Area = \frac{h}{2}(y_0 + 2y_1 + 2y_2 + 2y_3 + y_4)\]Distance = 8110 m
| Scheme | Marks | AO |
|---|---|---|
| Explains means of gaining a more accurate estimate For example, “integrate the quadratic between 20 and 100” Must include limits for integration. Or Use the quadratic to calculate y values in the trapezium rule or other appropriate numerical method. | E1 | 2.4 |
| (1) | ||
| (5 marks) |
Typical solution
Integrates the quadratic between the limits 20 and 100.