
June 2019 Paper 2 Q10
10 The diagram below shows a velocity-time graph for a particle moving with velocity \(v\) m s−1 at time \(t\) seconds.
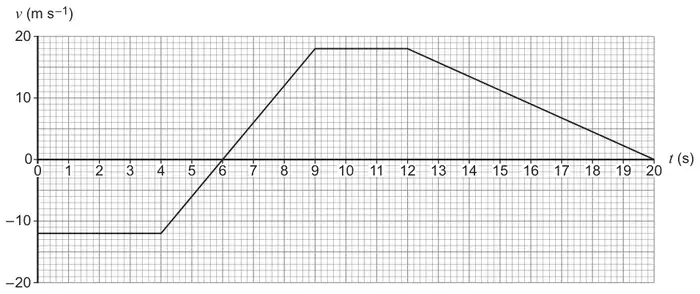
Which statement is correct?
Tick (✓) one box. [1 mark]
- The particle was stationary for \(9 \leqslant t \leqslant 12\)
- The particle was decelerating for \(12 \leqslant t \leqslant 20\)
- The particle had a displacement of zero when \(t = 6\)
- The particle’s speed when \(t = 4\) was \(-12\) m s−1
| Scheme | Marks | AO |
|---|---|---|
| Ticks correct box | B1 | 2.2a |
| (1 mark) |
Typical solution
The particle was decelerating for \(12 \leqslant t \leqslant 20\)