June 2018 Paper 2 Q12
12 The graph below shows the velocity of an object moving in a straight line over a 20 second journey.
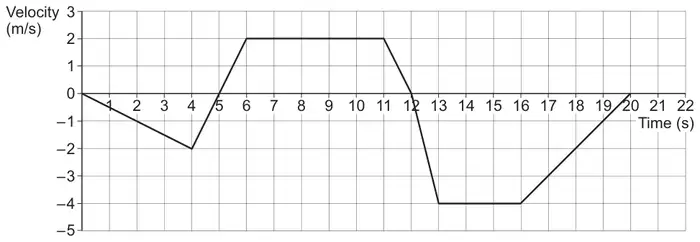
(a) Find the maximum magnitude of the acceleration of the object. [1 mark]
(b) The object is at its starting position at times 0, \(t_1\) and \(t_2\) seconds.
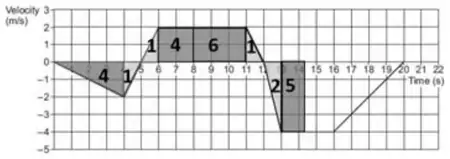
Find \(t_1\) and \(t_2\) [4 marks]
| Scheme | Marks | AO |
|---|---|---|
| Finds the steepest gradient. Ignore units. Do not allow -4. | B1 | AO1.1b |
Typical solution
\(4\ \text{m s}^{-2}\)
| Scheme | Marks | AO |
|---|---|---|
| Shows evidence of determining areas above and below the time axis for values of \(t\) between 7 and 9 inclusive Evidence may include values or indication on a diagram | M1 | AO3.1b |
| Deduces \(t_1\) value correctly. | A1 | AO2.2a |
| Shows evidence of determining areas above and below the time axis for values of \(t\) between 13 and 15 inclusive Evidence may include values or indication on a diagram | M1 | AO1.1a |
| Deduces \(t_2\) value correctly | A1 | AO2.2a |
| (5 marks) |
Typical solution