
June 2021 Paper 2 Q14
14 A motorised scooter is travelling along a straight path with velocity \(v\) m s−1 over time \(t\) seconds as shown by the following graph.
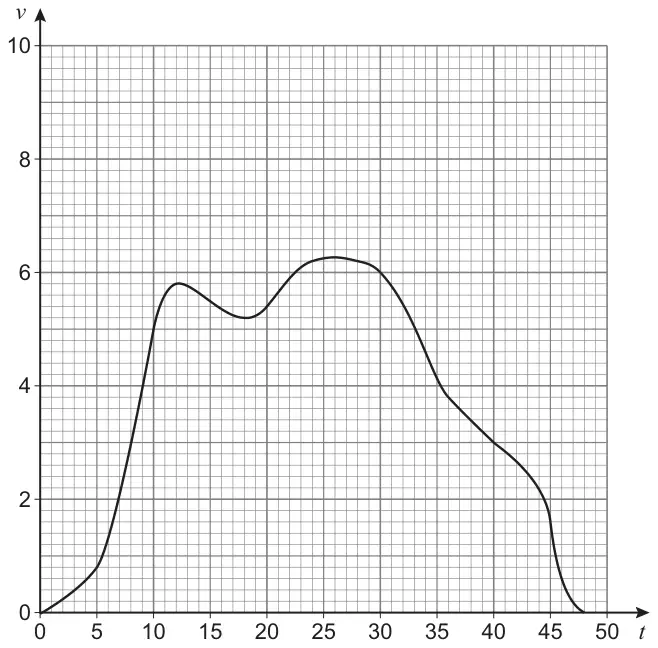
Noosha says that, in the period \(\mathbf{12 \leqslant t \leqslant 36}\), the scooter travels approximately 130 metres.
Determine if Noosha is correct, showing clearly any calculations you have used. [4 marks]
| Scheme | Marks | AO |
|---|---|---|
| Interprets the problem to consider the area beneath the curve | M1 | 3.1b |
| Divides an appropriate area into at least three polygons and finds at least one correct area for their chosen method | A1 | 1.1b |
| Obtains a total area for the interval 12 < t < 36 using their method AWFW 125 – 135 | M1 | 1.1a |
| Compares their total area with Noosha’s estimate to conclude that her result was reasonable | R1 | 1.1b |
| (4 marks) |
Typical solution
Distance = area below the curve
Split into four trapezia
Trapezium 1 = \(\frac{6}{2}\)(5.8 + 5.2) = 33
Trapezium 2 = \(\frac{7}{2}\)(5.2 + 6.2) = 39.9
Trapezium 3 = \(\frac{5}{2}\)(6.2 + 6) = 30.5
Trapezium 4 = \(\frac{6}{2}\)(6 + 3.8) = 29.4
Total = 132.8 \(\approx 130\)
Noosha’s estimate was reasonable
Notes
Trapezium 4 corrected from the printed mark scheme: it prints “= 30.5”, but \(\frac{6}{2}(6 + 3.8) = 29.4\), which is the value that gives the printed total of 132.8.