
Numeracy Higher June 2017 Unit 1 Q10
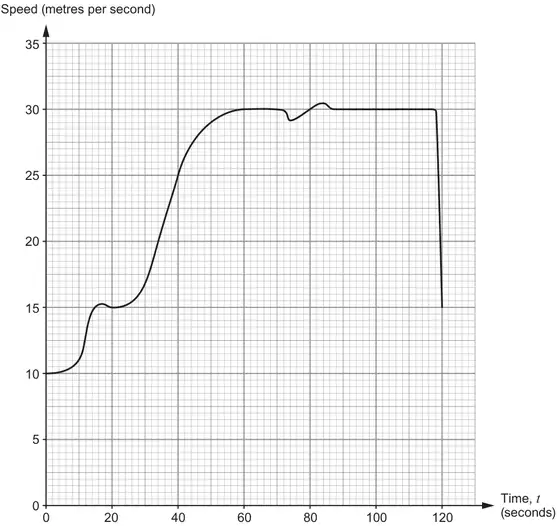
10. The graph below shows a 120-second section of Iestyn’s car journey to work this morning.
(a)
(i) At \(t\) = 50 seconds, estimate the acceleration of Iestyn’s car in m/s2.
Leave your answer as a fraction. [3]
Leave your answer as a fraction. [3]
(ii) At another time, Iestyn calculated the acceleration of the car to be \(0{\cdot}2\dot{4}\) m/s2.
Write this recurring decimal as a fraction. [2]
Write this recurring decimal as a fraction. [2]
(b)
(i) Calculate an estimate of the distance travelled by Iestyn’s car in the first 80 seconds of his journey.
You must consider the speed of the car when \(t\) = 0, 20, 40, 60 and 80 seconds. [4]
You must consider the speed of the car when \(t\) = 0, 20, 40, 60 and 80 seconds. [4]
(ii) Hence, calculate an estimate of the average speed of Iestyn’s car for this entire 120-second section of his car journey.
Give your answer in m/s. [4]
Give your answer in m/s. [4]
| Scheme | Marks | Comments |
|---|---|---|
| (i) Tangent drawn at t = 50 | S1 | |
| Idea of increase in speed ÷ increase in time | M1 | Ignore signs for M1 only Allow 1 slip in reading the scale for M1 only |
| Reasonable approximation for the gradient | A1 | Only award if S1 awarded Accept a fraction not in its lowest terms Mark final answer |
| (ii) e.g. 10x = 2·444… and 100x = 24·444… and attempt to subtract | M1 | OR x = 0·2444… and 10x = 2·444… |
| 22/90 (ISW) | A1 | M1A0 for 2·2/9 100x – x leads to 242/990 (which simplifies to 22/90). ISW |
| Scheme | Marks | Comments |
|---|---|---|
| (i) Sight of speeds of 10, 15, 25, 30 | B1 | |
| Split into at least 4 areas and attempt to sum | M1 | |
| (Area =) ½×20×(10+30 + 2(15 + 25 + 30)) | M1 | Or equivalent. (Areas of 250, 400, 550, 600) (If 8 areas used, areas of 110, 135, ≈160, ≈210, 270, 295, 300, 300) Allow 1 slip in reading the scale |
| = 1800 (m) | A1 | CAO. A1 for an answer of ≈1780 (m) if 8 areas used. CAO. |
| (ii) (Total distance =) 1800 + 30 × (38 to 40 inclusive) | M1 | FT ‘their 1800’ |
| = 2940 to 3000 (m) | A1 | |
| (Average speed =) total distance ÷ 120 | M1 | FT ‘their total distance’ |
| = 24·5 to 25 (m/s) | A1 |