
Numeracy Intermediate November 2018 Unit 2 Q7
7. Tube Cycles makes a large number of bikes each day.
The graph shows the number of bikes made on 1st July each year from 2012 to 2017.
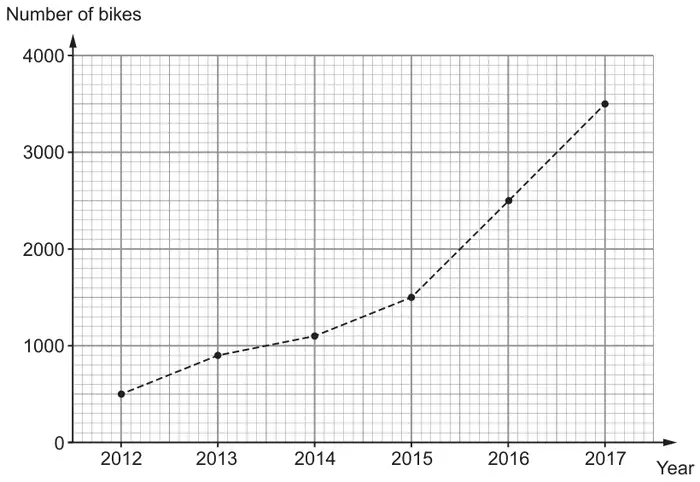
(a) How many bikes were made on 1st July 2014? [1]
Circle your answer.
Circle your answer.
1010 1020 1050 1100 1200
(b) From the graph, is it possible to say how many bikes were made on 1st December 2014?
You must give a reason for your answer. [1]
You must give a reason for your answer. [1]
(c) Complete the statement below. [1]
‘On 1st July 2017, there were …………… times as many bikes made as on 1st July 2012.’
(d) On 1st December 2016, 4000 bikes were made at the Tube Cycles factory.
The Tube Cycles factory was working at 80% capacity on that day.
This means that only 80% of the maximum possible number of bikes were made.
When the factory works at 95% capacity, how many bikes are made in one day? [3]
The Tube Cycles factory was working at 80% capacity on that day.
This means that only 80% of the maximum possible number of bikes were made.
When the factory works at 95% capacity, how many bikes are made in one day? [3]
(e)
(i) In October 2018, the manager of the Tube Cycles factory recorded the number of bikes made each day.
Here are her results.
Here are her results.
| Number of bikes, \(b\) | Frequency |
|---|---|
| \(1000 \leqslant b \lt 2000\) | 3 |
| \(2000 \leqslant b \lt 3000\) | 12 |
| \(3000 \leqslant b \lt 4000\) | 9 |
| \(4000 \leqslant b \lt 5000\) | 7 |
Calculate an estimate of the mean number of bikes made per day during October 2018. [4]
(ii) Which group contains the median number of bikes made per day?
Circle your answer. [1]
Circle your answer. [1]
\(1000 \leqslant b \lt 2000\) \(2000 \leqslant b \lt 3000\) \(3000 \leqslant b \lt 4000\)
\(4000 \leqslant b \lt 5000\) Can’t tell
Corrected by Westie's Workshop
- The board's question paper printed “times as many bikes made than on”. Changed to “times as many bikes made as on” because “as many … as” is the correct comparison.
Original: see the board's question paper PDF (link above).
| Scheme | Marks | Comments |
|---|---|---|
| 1100 | B1 |
| Scheme | Marks | Comments |
|---|---|---|
| No or can’t tell implied AND a reason, e.g. ‘graph only gives data for 1st July’, ‘only shows bikes made on 1st July’, ‘only shows July not any other month’, ‘shows yearly not monthly’, ‘not any specified months’, ‘intermediate values have no meaning’, ‘don’t know anything about the number of bikes made in December’ | E1 | Ignore additional incorrect statements Allow with no or can’t tell implied, e.g. ‘does not include months just the years as a whole’, ‘the graph is for July not December’, ‘shows bikes made on 1st July’, ‘shows July not any other month’, Do not accept with no or can’t tell implied, e.g. ‘only 10 little squares and there are 12 months’, ‘cannot fit it in the gaps’, ‘because it is the half way point’, ‘the graph is going up in years’, ‘cannot read the graph accurately’, ‘because it is grouped data’, |
Corrected by Westie's Workshop
- The board's mark scheme printed “only 10 little square and”. Changed to “only 10 little squares and” because the plural “squares” is needed after “10”.
Original: see the board's mark scheme PDF (link above).
| Scheme | Marks | Comments |
|---|---|---|
| 7 | B1 |
| Scheme | Marks | Comments |
|---|---|---|
| Idea that 4000 cycles is 80% | S1 | Interpretation of link between 80% and 4000 cycles, e.g. sight of any one of the following, provided not with incorrect idea of using 20% or (95 – 80 =) 15%
|
| 95 × 4000 ÷ 80 or 95 × 50 or equivalent | M1 | |
| 4750 (cycles) | A1 |
| Scheme | Marks | Comments |
|---|---|---|
| (i) Midpoints 1500, 2500, 3500, 4500 | B1 | |
| 1500×3 + 2500×12 + 3500×9 + 4500×7 (= 4500 + 30 000 + 31500 + 31500 = 97500) | M1 | FT ‘their midpoints’ provided each one lies within the appropriate group, including bounds throughout Use of lower bound gives 82 000 Use of upper bounds gives 113 000 |
| ÷ 31 | m1 | Use of lower bounds gives 2645(.16...) Use of upper bounds gives 3645(.16...) |
| 3145(.16..cycles) or 3145.2 (cycles) | A1 | |
| (ii) \(3000 \;\leqslant\; b \;\lt\; 4000\) | B1 |