
Numeracy Higher November 2018 Unit 2 Q7
7. Danielle is studying the growth of the population of Wales.
She used the 2001 and 2011 Census data to draw these histograms.
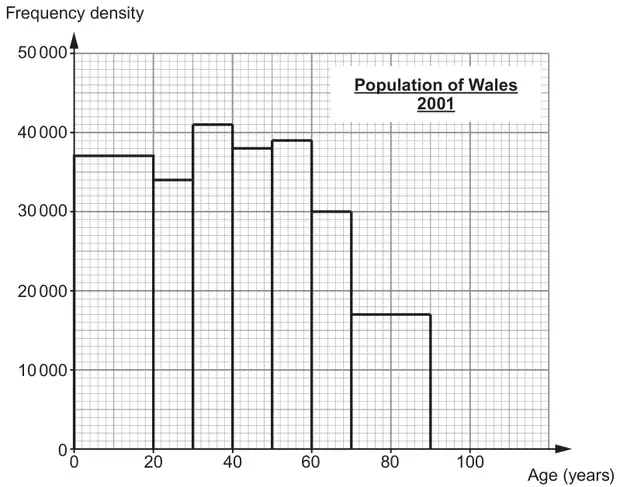
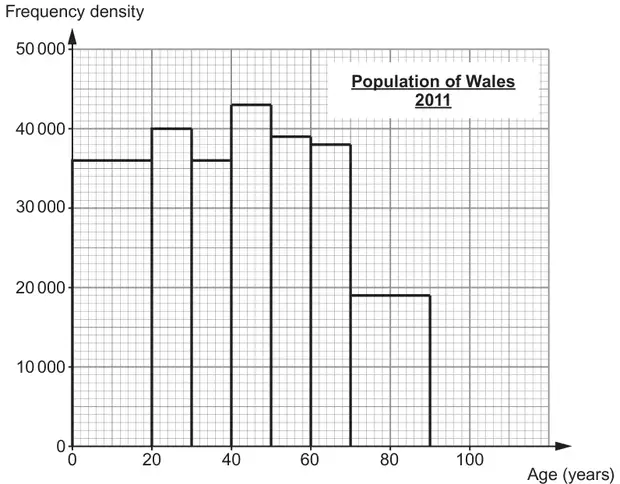
(a) Use Danielle’s histograms to answer the following questions:
(i) Circle the earliest decade in which anyone included in the histograms could have been born. [1]
1890–1899 1900–1909 1910–1919 1920–1929 1930–1939
(ii) From Danielle’s histogram, the population of under-50s in Wales was 1 870 000 in 2001.
Calculate the increase in the population of under-50s in Wales from 2001 to 2011. [3]
Calculate the increase in the population of under-50s in Wales from 2001 to 2011. [3]
(iii) The 60 to 69-year-olds saw the biggest increase in population from 2001 to 2011.
Calculate the percentage increase in the number of 60 to 69-year-olds from 2001 to 2011.
Give your answer to the nearest whole number. [3]
Calculate the percentage increase in the number of 60 to 69-year-olds from 2001 to 2011.
Give your answer to the nearest whole number. [3]
(b)
| Age group | Population in 2001 | Population in 2011 |
|---|---|---|
| 90 and over | 19 300 | 25 200 |
The data in this table was also available to Danielle.
Explain why Danielle did not include this data in her histograms. [1]
(c) The number of 40 to 49-year-olds in 2011 was different to the number of 30 to 39-year-olds in 2001.
Give a full explanation for what could have caused this. [1]
Give a full explanation for what could have caused this. [1]
| Scheme | Marks | Comments |
|---|---|---|
| (i) 1910 – 1919 | B1 | |
| (ii) (Population of under-50s in 2011) 36000×20 + 40000×10 + 36000×10 + 43000×10 | M1 | Note: check histogram for working Allow M1 for one error only in reading the scale (36 000 read as 35 000 is 1 error) Allow M1 for the sum of any 3 correct products Ignore any additional calculations |
| = 1 910 000 (Increase in population =) 40 000 ISW | A1 A1 | CAO FT ‘their 1 910 000’ provided they are working with the first 4 bars AND their answer is > 0 A percentage increase of 2.139…% implies M1A1A0 unless 40 000 seen |
| (iii) \(\dfrac{8(0\,000)}{30(0\,000)}\) (×100) | M1 | Place value of both numbers needs to be consistent Allow \(\dfrac{76(000)}{285(000)}\) from use of width 9.5 Allow \(\dfrac{72(000)}{270(000)}\) from use of width 9 Allow a method to find 8(0 000) as a % of 30(0 000). Needs to be convincing |
| = 27(%) | A2 | A1 for 26(%) or 26(.6…%), or A1 for 0.27 |
Alternative
Alternative method: (a)(ii)
| Scheme | Marks | Comments |
|---|---|---|
| 6000×10 (+ 5000×10) – 1000×20 (− 5000×10) | M2 | Allow M1 for one error only in reading the scale Allow M1 for the sum of any 3 correct products Ignore any additional calculations |
| = 40 000 ISW | A1 | CAO A percentage increase of 2.139…% implies M1A1A0 unless 40 000 seen |
Alternative
Alternative method: (a)(iii)
| Scheme | Marks | Comments |
|---|---|---|
| \(\dfrac{38(0\,000)}{30(0\,000)}\) (×100) − 1(×100) | M1 | Place value of both numbers needs to be consistent Allow \(\dfrac{361(000)}{285(000)}\) from use of width 9.5 Allow \(\dfrac{342(000)}{270(000)}\) from use of width 9 Allow a method to find 38(0 000) as a % of 30(0 000) provided they show an intention to go on to subtract 100% Needs to be convincing |
| = 27(%) | A2 | A1 for 26(%) or 26(.6…%), or A1 for 0.27 |
| Scheme | Marks | Comments |
|---|---|---|
| Valid reason e.g. ‘She didn’t know how wide to make the bars’, or ‘It doesn’t tell Danielle how old the oldest people were’ | E1 | Allow e.g. ‘The age group is not accurate. It doesn’t say the oldest age in the group’ Do not accept e.g. ‘She wouldn’t be able to fit it on the graph paper’, or ‘It’s a small amount compared to the others’, or ‘It’s not an accurate age group’ (without further explanation) |
| Scheme | Marks | Comments |
|---|---|---|
| Valid explanation that recognises there has been an increase in the population in this age group e.g. ‘(more) people (of this age group) came to live in Wales (than left Wales)’ | E1 | Do not accept an explanation that implies these are 2 different groups of people Do not accept e.g. ‘Due to immigration and people leaving the country’, or ‘There has been an increase’ |