
Numeracy Foundation June 2019 Unit 1 Q9
9. The distance a car will travel using 1 gallon of fuel is called its fuel economy.
The fuel economy of a number of cars with different engine sizes is shown below.
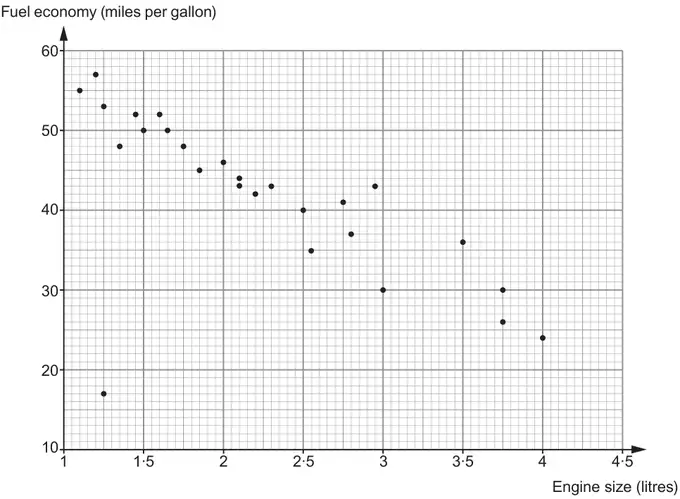
Use the scatter diagram to answer the following questions.
(a) State the fuel economy of the car with the largest engine size. [1]
Fuel economy …………… miles per gallon
(b) State the engine size of the car with a fuel economy of 42 miles per gallon. [1]
Engine size …………… litres
(c)
(i) Calculate the mean fuel economy of the 5 cars with the smallest engine sizes. [3]
Mean fuel economy is …………… miles per gallon
(ii) Why is this not a suitable average for cars with engine sizes of less than 1·5 litres? [1]
(d) Draw, by eye, a line of best fit on the scatter diagram. [1]
(e) Siân says,
| The scatter diagram is more reliable to estimate the fuel economy of cars with engine sizes less than 2·5 litres. |
Do you think Siân is correct?
Yes ☐ No ☐ Don’t Know ☐
You must give a reason for your answer. [1]
| Scheme | Marks | Comments |
|---|---|---|
| 24 (miles per gallon) | B1 |
| Scheme | Marks | Comments |
|---|---|---|
| 2.2 (litres) | B1 |
| Scheme | Marks | Comments |
|---|---|---|
| (i) Sight of 55, 57, 53, 17, 48 | B1 | |
| (55+57+53+17+48) ÷ 5 | M1 | FT ‘method to sum 5 numbers’ provided at least 3 are correct |
| (230 ÷ 5 =) 46 (miles per gallon) | A1 | FT provided at least 4 correct values are used FT responses must be evaluated not left as improper fractions, however allow rounded or truncated final answers |
| (ii) Explanation of why it is not a suitable average, e.g. ‘included the rogue value’, ‘gives a lower value', ‘17 appears to be an anomaly’, ‘one car goes far less than the others’, ‘because there is one really low value’, ‘mean is unduly affected by use of 17’ | E1 | Allow, e.g. ‘only considered 5 cars', ‘not enough cars’, ‘because there are fewer cars’, ‘insufficient data’, ‘not considered all the cars with engines less than 1.5 litres’, ‘not considered all 6 (or 7) cars’ |
| Scheme | Marks | Comments |
|---|---|---|
| Straight line of best fit, following the trend with some points above and some below the line | B1 | Allow slight adjustment down, considering the rogue value, the trend must be correct The line of best fit, shown or if extended, must not be connected to any corners of the graph paper Allow intention of a straight line |
| Scheme | Marks | Comments |
|---|---|---|
| Unambiguous decision with a reason, e.g. ‘Yes, as more cars with engines less than 2.5 litres’, ‘Yes, many cars with engine size less than 2.5 litres’ ‘Yes, 15 or 16 cars shown <2.5 litres’, ‘Yes, as only 10 cars (out of 26) with ≥2.5 litre engine’, 'Yes, more data', “Yes, more readings’ 'Yes, stronger correlation', 'Yes, (more) points are closer to the line of best fit', ‘Yes, more cars’, ‘Don’t know (or No), as there is one rogue value for a car with engine size <2.5 litres’, ‘No, data not a large set’, | E1 | Allow, e.g. ‘Yes, they are closer together’, ‘Yes, plots before 2.5 are close together’ Yes, results are quite similar’ ‘Yes, they have a similar range in fuel economy’, ‘Yes, as only 10 cars (out of 26) with >2.5 litre engine’ Do not accept, e.g. ‘Yes, because before there is a lot of fuel economy’, Do not accept contradiction between the choice of yes, no and don't know and their reason |