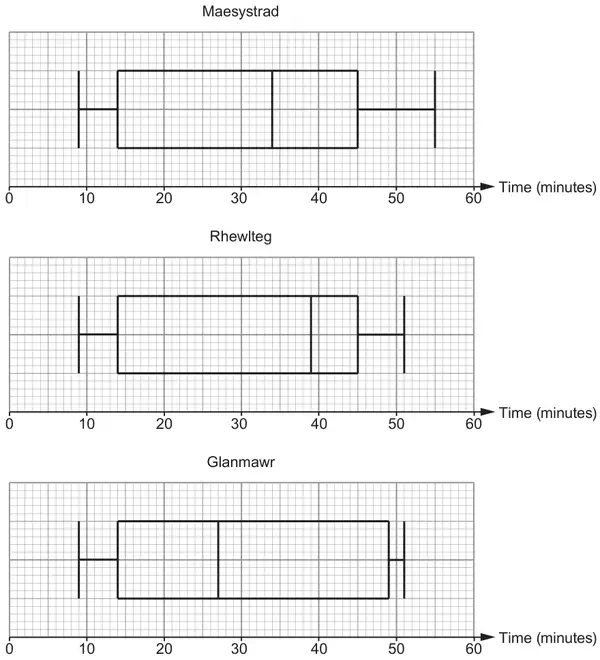
(a) Maesystrad, Rhewlteg and Glanmawr are three colleges. Each college recorded the times Year 12 students took to travel to college. The results are displayed in the box-and-whisker plots below.
(i) Which of the three colleges has the greatest range of times? What is the range of times for this college? [1]
College …………………… Range …………………… minutes
(ii) On average, in which college did Year 12 students have the longest travel times? You must give a reason for your answer. [1]
College: ……………………
Reason: ……………………
(iii) Which college has the greatest difference between the median and the lower quartile? What is this difference? [1]
College …………………… Difference …………………… minutes
(iv) Which of the three colleges has the greatest number of Year 12 students? Give a reason for your answer. [1]
Maesystrad ☐ Rhewlteg ☐ Glanmawr ☐ Don’t know ☐
Reason: ……………………
(b) At another college, Wynne College, there are 240 students in Year 12.
The interquartile range of the times taken for these students to travel to college is 32 minutes.
(i) How many of these students have travel times within this interquartile range? [1]
…………………… students
(ii) 75% of the Year 12 students at Wynne College take less than 55 minutes to travel to college. Complete the following statement.
‘25% of the Year 12 students at Wynne College take less than
…………………… minutes to travel to college.’ [1]
Mark scheme (a)
(i)
Scheme
Marks
Comments
Maesystrad AND 46 (minutes)
B1
(ii)
Scheme
Marks
Comments
Rhewlteg AND gives decision used unambiguously as median
B1
Accept decision based on median without the use of the term ‘median’, e.g. ‘half of them took more than 39 minutes’ Allow, e.g.
Rhewlteg as median is 38 (minutes) (from misreading the scale correct median is 39 minutes)
Rhewlteg as average is 39 (minutes)
Do not accept contradictions, decision needs to be solely based on the median
(iii)
Scheme
Marks
Comments
Rhewlteg AND 25 (minutes)
B1
(iv)
Scheme
Marks
Comments
‘Don’t know’ indicated or unambiguously implied AND reason, e.g. ‘not told’, ‘it doesn’t say (on the diagam)’, ‘doesn’t give you the number of students/pupils’, ‘doesn’t tell you how many were asked’, 'it is about travel times (not number of students)', ‘only gives the timings’, ‘it shows distribution of travel times, not number of students’, ‘only shows proportions of the students’
E1
Allow, e.g. ‘doesn’t give you the frequency (of students)’,
Do not accept, e.g. ‘can’t tell’, ‘not enough data’, ‘shows only median, range and measures of spread’
We'd like to use Google Analytics cookies to count visits and see which pages help most. They're optional, and the site works exactly the same either way. Privacy policy