
Higher November 2017 Unit 2 Q16
16. Each of the two graphs below is described by one of the equations on the right.
Put a tick in the box next to the equation which correctly describes each graph. [2]
Graph A
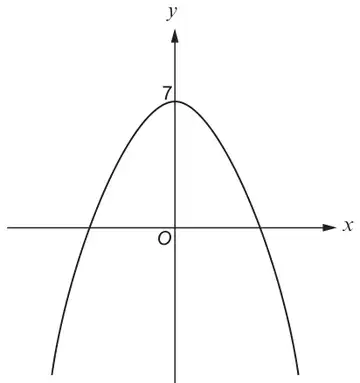
| Equation describing graph A | |
|---|---|
| \(y = 7x^2\) | ☐ |
| \(y = -(x + 7)^2\) | ☐ |
| \(y = (x - 7)^2\) | ☐ |
| \(y = 7 - x^2\) | ☐ |
| \(y = x^2 + 7\) | ☐ |
Graph B
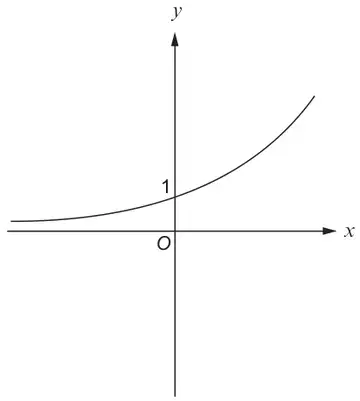
| Equation describing graph B | |
|---|---|
| \(y = x^2 + 1\) | ☐ |
| \(y = 2^x\) | ☐ |
| \(y + 1 = x^2\) | ☐ |
| \(y = \dfrac{1}{x}\) | ☐ |
| \(y = x^0\) | ☐ |
| Scheme | Marks | Comments | ||||||||||
|---|---|---|---|---|---|---|---|---|---|---|---|---|
Graph A
| B1 | |||||||||||
Graph B
| B1 |