
Higher November 2017 Unit 1 Q18
18. The following diagram shows a sketch of the curve \(y = f(x)\).
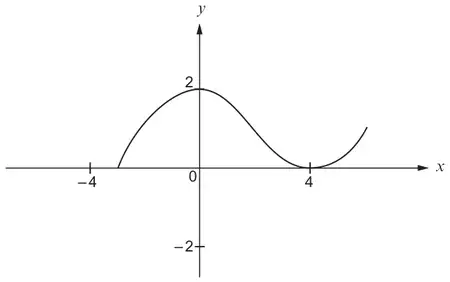
The curve is transformed, as shown below.
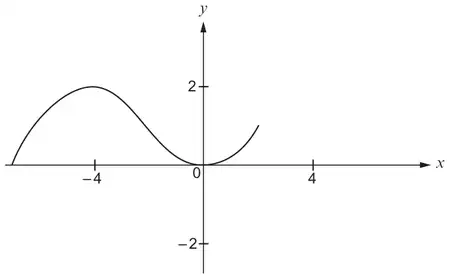
Using function notation, complete the following to give the equation of the transformed curve. [1]
The equation of the transformed curve is
\(y\) = …………………………………………
| Scheme | Marks | Comments |
|---|---|---|
| \(y = f(x + 4)\) | B1 |