Your progress
Ticks are kept only in this browser: clearing your browsing data or changing device loses them. · ·

Higher June 2017 Unit 2 Q20

WJECHigherCurrent spec4 marksGraphical Transformations

20. A sketch of the graph \(y = f(x)\) is shown below.
Two specific points are shown on the graph. They are called a maximum point and a minimum point.
The maximum point shown is (–2, 2) and the minimum point shown is (2, –2).
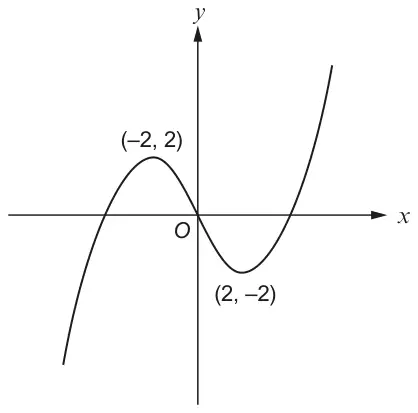
Sketch of the cubic-shaped graph y = f(x) through the origin O, with maximum point (−2, 2) and minimum point (2, −2)

The graphs below are transformations of \(y = f(x)\).
Draw a line connecting each graph to the equation describing the transformation.
One has been done for you. [4]
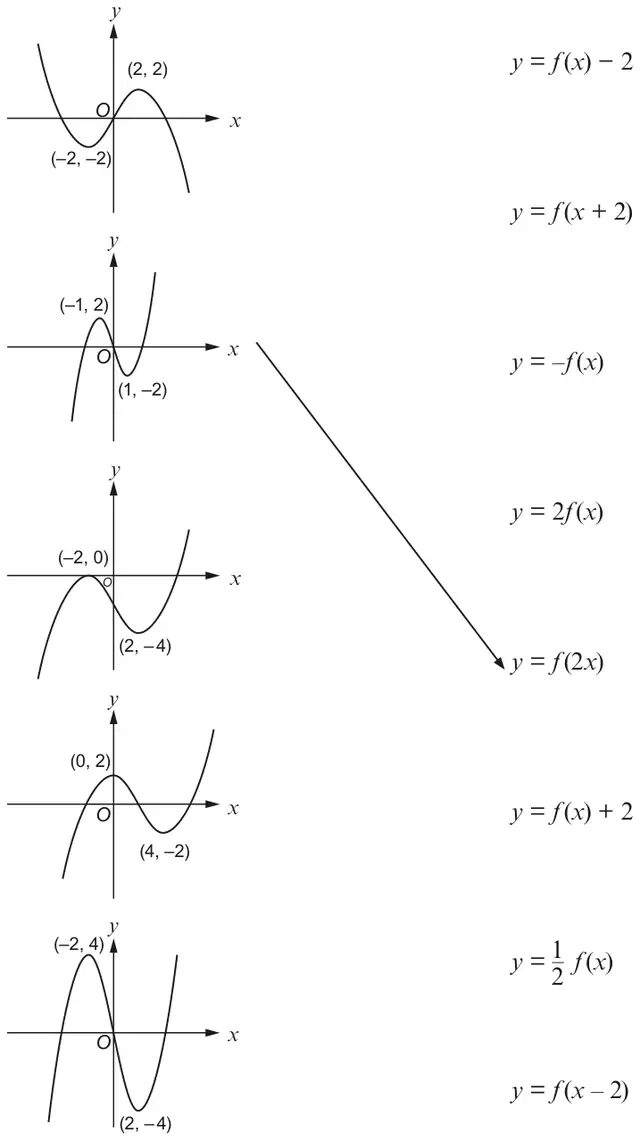
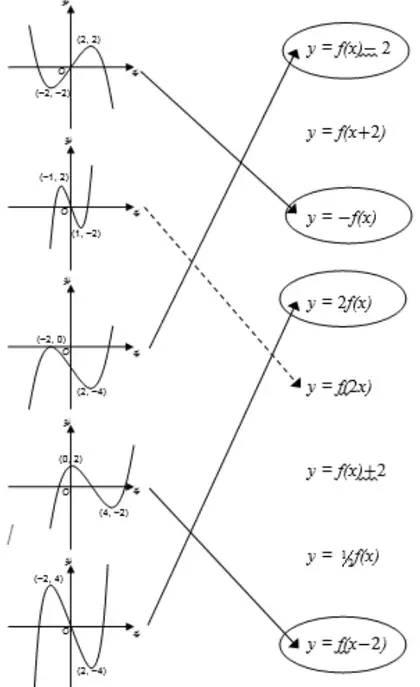
Five transformed graphs on the left: (1) max (2, 2), min (−2, −2) inverted; (2) max (−1, 2), min (1, −2); (3) max (−2, 0), min (2, −4); (4) max (0, 2), min (4, −2); (5) max (−2, 4), min (2, −4). Equations on the right: y = f(x) − 2, y = f(x + 2), y = −f(x), y = 2f(x), y = f(2x), y = f(x) + 2, y = ½ f(x), y = f(x − 2). Graph (2) is already joined to y = f(2x).