
Higher June 2017 Paper 1 Q18
18. The diagram shows a sketch of the graph of \(y = f(x)\).
The point A has coordinates \((1, 0)\) and the point B has coordinates \((0, 2)\).
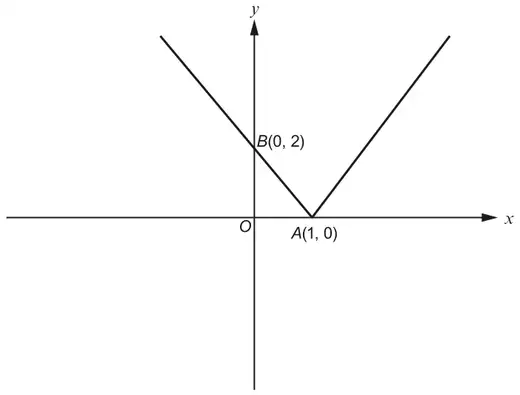
(a) Sketch the graph of \(y = -f(x)\) on the axes below.
You must indicate the coordinates of the new positions of the points A and B. [2]
You must indicate the coordinates of the new positions of the points A and B. [2]
(b) Sketch the graph of \(y = f(x) - 3\) on the axes below.
You must indicate the coordinates of the new positions of the points A and B. [2]
You must indicate the coordinates of the new positions of the points A and B. [2]
| Scheme | Marks | Comments |
|---|---|---|
| Reflection in \(x\)-axis | B1 | Ignore coordinates for this mark; vertex must be on the positive \(x\)-axis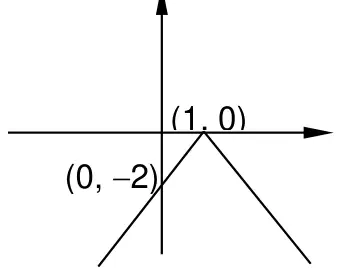 |
| Correct coordinates seen or scale marked | B1 |
| Scheme | Marks | Comments |
|---|---|---|
| Translation through \(\begin{pmatrix}0\\k\end{pmatrix}\) where \(k \lt 0\) | B1 | Ignore coordinates for this mark; vertex must be in 4th quadrant;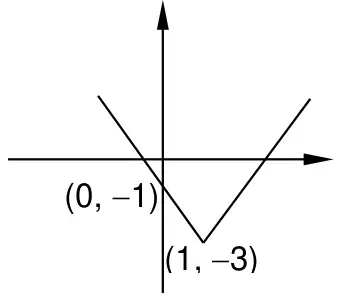 |
| Correct coordinates seen or scale marked | B1 | |
| (4) |