
Numeracy Intermediate June 2023 Unit 1 Q11
11. Deva Design Service employs 60 people.
Employees were asked to log on to their computer at 9 a.m. on Thursday.
The number of employees logged on was recorded every 10 seconds from 9 a.m.
The results are displayed in the cumulative frequency diagram shown below.
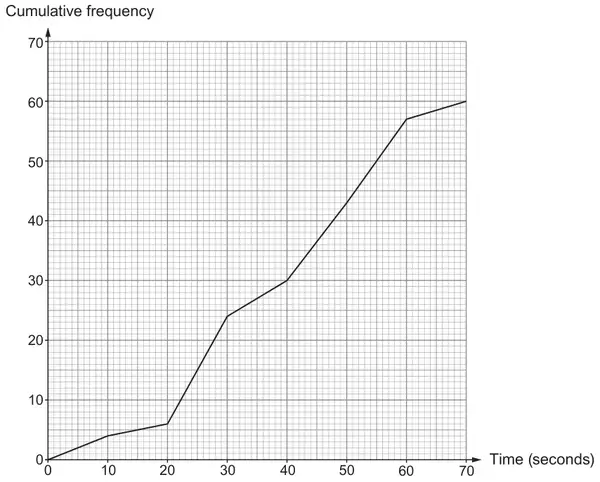
(a) Use the cumulative frequency diagram to estimate the median time taken by the employees to log on. [1]
…………… seconds
(b) Deva Design Service has a policy that states the following:
‘90% of employees should be logged on to their computer by 9:01 a.m.’
Show that this policy was met on Thursday.
You must show all your working. [3]
| Scheme | Marks | Comments |
|---|---|---|
| 40 (seconds) | B1 |
| Scheme | Marks | Comments |
|---|---|---|
| Penalise incorrect units -1 only. | ||
| 0.9 × 60 or 60 - 0.1 × 60 | M1 | |
| = 54 (employees) | A1 | |
| In 60 seconds, 57 employees logged on or 54 employees logged on within 58 seconds | B1 | Ignore additional spurious statements Check the diagram for indication, provided values are written FT ‘their 54 employees’ provided M1 previously awarded and number of seconds < 60 |
11(b) Alternative method 1:
| Scheme | Marks | Comments |
|---|---|---|
| Penalise incorrect units -1 only. | ||
| By 1 minute, 57 employees logged on | B1 | |
| (100 ×) 57/60 | M1 | |
| 0.95 or 95(%) or 570/600 compared with (90% =) 540/600 | A1 | If M0 A0, award SC1 for ‘only 5% (or 0.05) not logged on’ If no marks, award SC1 for an answer of 93(.3..)% or 96(.6..)% or rounded to 97% or equivalents as decimals from use of 56 or 58 respectively |
The alternative method is printed in italics in the original.
11(b) Alternative method 2:
| Scheme | Marks | Comments |
|---|---|---|
| For clearly considering employees not logged on, must be evidence of this before awarding marks | Penalise incorrect units -1 only. | |
| (0.1 × 60 =) 6 (employees not logged on) | B1 | |
| (After 9:01 a.m.) 60 – 57 | M1 | |
| 3 (employees not logged on) | A1 | If M0 A0, award SC1 for an answer of 4 or 2 employees from sight of calculation 60 - 56 or 60 - 58 |
The alternative method is printed in italics in the original.
11(b) Alternative method 3:
| Scheme | Marks | Comments |
|---|---|---|
| For clearly considering employees not logged on, must be evidence of this before awarding marks | Penalise incorrect units -1 only. | |
| (0.1 × 60 =) 6 (employees not logged on) | B1 | |
| (For 6 employees not logged on graph gives) 58 seconds | M1 | FT ‘their 6 employees’’ provided 0.1 × 60 attempted and ‘their 58 seconds’ < 60 |
| Conclusion that after 58 seconds there are fewer than 6 employees not logged (i.e. more than 90% logged on) | A1 |
The alternative method is printed in italics in the original.