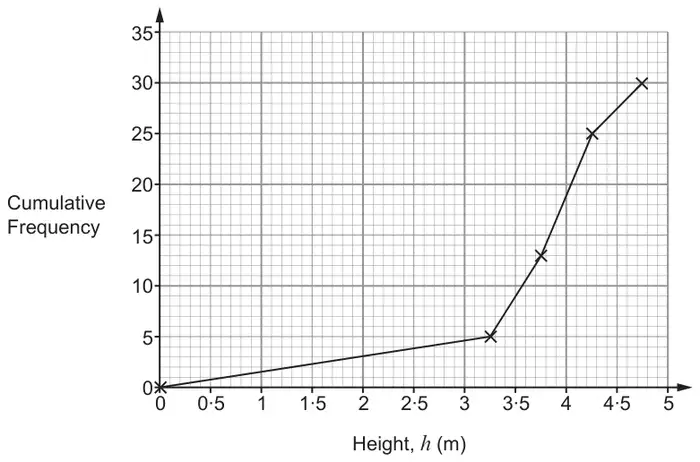
(a) Gracie has collected data about the heights of 30 giant sunflowers. The table shows her results.
Height, \(h\) (m)
\(3 \lt h \leqslant 3{\cdot}5\)
\(3{\cdot}5 \lt h \leqslant 4\)
\(4 \lt h \leqslant 4{\cdot}5\)
\(4{\cdot}5 \lt h \leqslant 5\)
Frequency
5
8
12
5
Gracie attempts to draw a cumulative frequency diagram.Make two different criticisms of Gracie’s diagram. [2]
(b) Gracie also collects data about the amount of money each of a group of 40 gardeners spent on their gardens during the months of April and May. The table shows the data for April.
Amount for April, (£\(x\))
\(0 \lt x \leqslant 30\)
\(30 \lt x \leqslant 40\)
\(40 \lt x \leqslant 50\)
\(50 \lt x \leqslant 60\)
\(60 \lt x \leqslant 80\)
Frequency
6
9
12
5
8
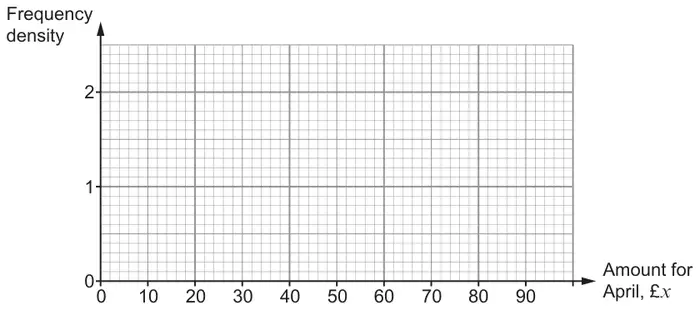
(i) Draw a histogram to represent the data for April. [4]
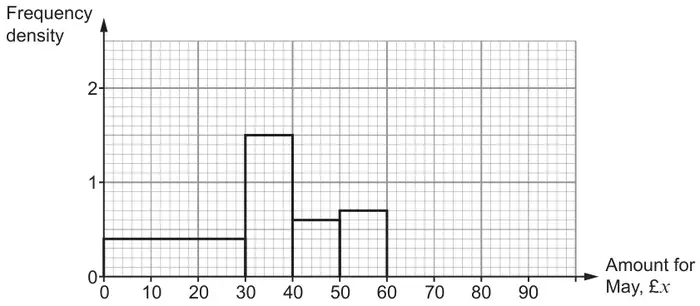
(ii) The histogram below represents the data for May.Calculate an estimate of how many more of the 40 gardeners spent £45 or less in May than spent £45 or less in April? You must show all your working. [3]
Mark scheme (a)
Scheme
Marks
Comments
Two valid, different criticisms e.g.
‘She has used the midpoint from each class (, not the upper, when plotting)’
‘She should have used the higher value from each group (for her plots, not the midpoint.)’
AND
‘The first point should not be at (0, 0), (it should be at (3, 0).)’
‘The graph shows there is data between 0 and 3 (when there is none.)’
E2
One comment about the midpoint being used and the other comment about the plot at the origin.
E1 for one valid criticism.
Mark scheme (b)
Scheme
Marks
Comments
(i) Frequency densities: 0·2, 0·9, 1·2, 0·5, 0·4 si
B2
B1 for either:
any 4 correct calculations from 6 ÷ 30, 9 ÷ 10, 12 ÷ 10, 5 ÷ 10, 8 ÷ 20
any 4 values correctly found.
Fully correct histogram
B2
FT candidate’s frequency density for B2 or B1 provided at least 3 frequency densities are correct.
We'd like to use Google Analytics cookies to count visits and see which pages help most. They're optional, and the site works exactly the same either way. Privacy policy