
Numeracy Foundation June 2023 Unit 1 Q5
5. A survey was carried out in the U.S.A.
743 teenagers were interviewed.
They were asked what type of information they posted on social media.
The results were displayed on the internet, as shown below.
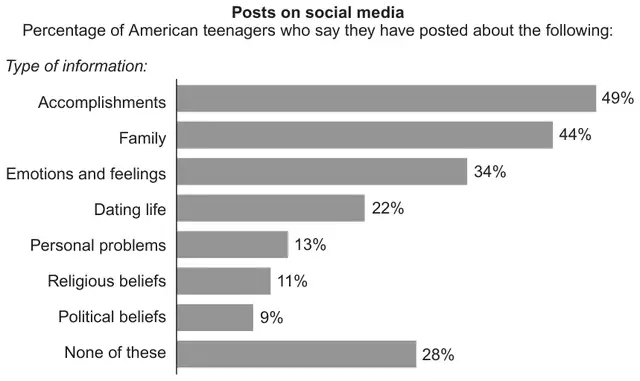
(a) How many times bigger is the percentage of the teenagers who posted about their family than the percentage who posted about their religious beliefs? [1]
(b) What fraction of these teenagers posted about their emotions and feelings?
Give your answer in its simplest form. [1]
Give your answer in its simplest form. [1]
(c) Dewi looks at the type of information posted by these teenagers.
What is the modal type of information? [1]
What is the modal type of information? [1]
The modal type of information is ……………
(d) What information would have been needed in the original data so that the following hypothesis could be tested? [1]
| In the U.S.A., teenage girls post about family more often than teenage boys. |
(e) How many of these 743 teenagers posted about their religious beliefs?
You must show all your working. [3]
You must show all your working. [3]
(f) Lottie is confused by the data in the diagram.
She says,
| This diagram can’t be right, as all the bars don’t add up to 100%. |
The diagram is correct.
Explain why the bars do not add up to 100%. [1]
| Scheme | Marks | Comments |
|---|---|---|
| 4 | B1 | Accept ‘×4’, ‘times 4’ or ‘11 × 4 = 44’ Do not accept a choice, e.g. ‘33% and 4 times’ |
| Scheme | Marks | Comments |
|---|---|---|
| 17/50 | B1 | CAO. Do not accept 34/100 or 17%/50% |
| Scheme | Marks | Comments |
|---|---|---|
| ‘Accomplishments’ | B1 | Allow ‘Accomplishments 49%’ Do not accept 49(%) |
| Scheme | Marks | Comments |
|---|---|---|
| Appropriate explanation, e.g. ‘(would have) needed to know the number of boys and girls in family category and total number of boys and the total of girls’, ‘(would have) needed to know the gender (or sex) of each of the teenagers’ | E1 | Ignore additional incorrect or spurious statements Allow, e.g. ‘split (the original data) into boys and girls’, ‘do another survey asking boys and girls separately’, ‘sex’, ‘gender’ ‘boys and girls on separate graphs’, ‘boys and girls’ ‘how many boys and girls took part in the survey’, ‘need number of girls and boys who took part in the survey’, ‘need number of boys and girls for family’, ‘need percentage of girls and percentage of boys’ Do not accept, e.g. ‘repeat the survey’, ‘more detailed data’ |
| Scheme | Marks | Comments |
|---|---|---|
| 743 × 11/100 or 74.3 + 7.43 or equivalent 81 or 82 (teenagers) | M1 A2 | Only award A2 provided not from incorrect working Award A1 for any of the following:
100 × 79 ÷ 743 (= 10.6…), 100 × 80 ÷ 743 (=10.76…), …, 100 × 85 ÷ 743 (= 11.4…) |
| Scheme | Marks | Comments |
|---|---|---|
| Suitable reason, e.g. ‘teenagers can select more than one type of information’, ‘some teenagers are represented by more than one row’ | E1 | Do not accept, e.g. ‘they have been rounded’, ‘because the data is grouped’ |