
Numeracy Higher June 2024 Unit 2 Q7
7. Sara and Tanvi are taking part in an orienteering race.
The start and finish points of the race are the same.
They will take different routes from the start point to get to the same last marker point.
They then head directly back to the start/finish point.
Here is a diagram showing some information about Sara’s route.
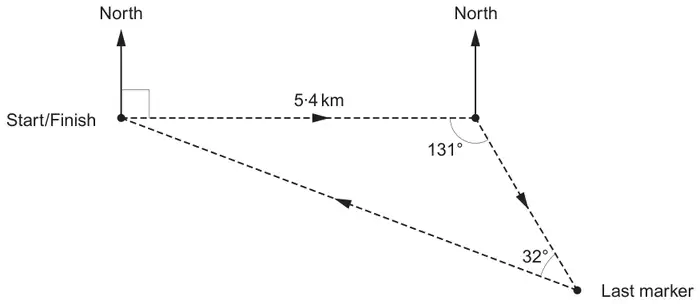
Diagram not drawn to scale
Show that the distance Sara travels from the last marker back to the finish point is 7·7 km, correct to 1 decimal place. [3]
The diagram below shows some information about Tanvi’s route.
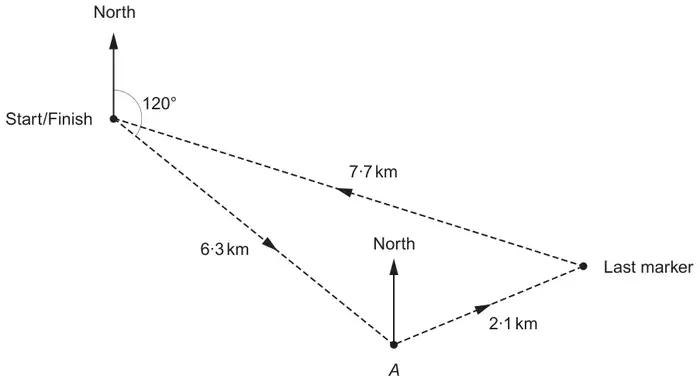
Diagram not drawn to scale
Tanvi started her race by running 6·3 km on a bearing of 120° to point \(A\).
She then ran 2·1 km to reach the last marker.
Calculate the bearing of the last marker from point \(A\). [5]
Bearing is ……………………… °
The map that Sara and Tanvi were each given before the start of the race was 33 cm long.
Tanvi decided to reduce the size of her map to a mathematically similar size.
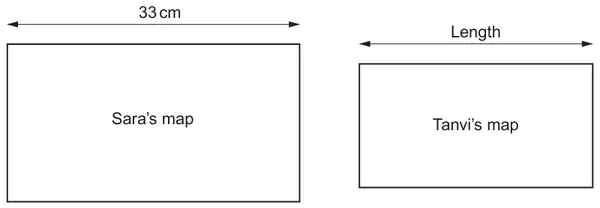
Diagram not drawn to scale
The area of Tanvi’s map is now 19% less than the area of Sara’s map.
Calculate the length of Tanvi’s map. [4]
Sara’s distance from the start, for the first part of her race, is shown in the graph below.
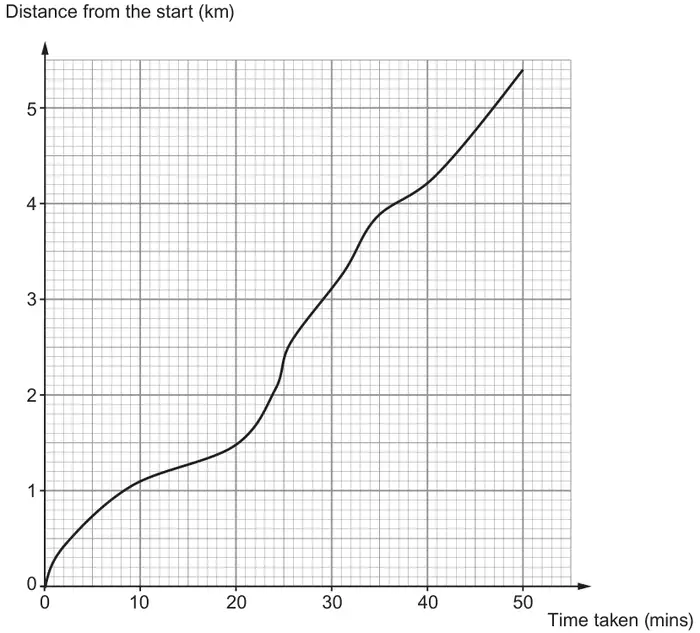
Estimate Sara’s speed 20 minutes after the start of the race.
Give your answer in miles per hour. [5]
From the formula list: In any triangle \(ABC\): Sine rule \(\dfrac{a}{\sin A} = \dfrac{b}{\sin B} = \dfrac{c}{\sin C}\); Cosine rule \(a^2 = b^2 + c^2 - 2bc\cos A\)
| Scheme | Mark | Comments |
|---|---|---|
| (x =) \(\dfrac{5.4 \times \sin 131^\circ}{\sin 32^\circ}\) | M2 | M1 for \(\dfrac{x}{\sin 131^\circ}\) = \(\dfrac{5.4}{\sin 32^\circ}\) or equivalent OR M1 for \(\dfrac{7.7}{\sin 131^\circ}\) = \(\dfrac{5.4}{\sin 32^\circ}\) or equivalent |
| = 7.69(06…) or 7.7 (km) | A1 | From M1, if 7.69(06…) seen award M2A1 From M1, if only 7.7 seen award M1A0 |
| Scheme | Mark | Comments |
|---|---|---|
| Allow use of 7.69(06…) for 7.7 Note: Use of sine rule with the angle on the left of the triangle of 13º can lead to a bearing of 064º, if seen please escalate | ||
| (Bottom angle =) \(\cos^{-1}\left(\dfrac{6.3^2 + 2.1^2 - 7.7^2}{2 \times 6.3 \times 2.1}\right)\) | M2 | = cos\(^{-1}\)(−31/54) or equivalent M1 for
|
| = 125(.03…) (º) | A1 | 124.6(5…) (º) if 7.69(06…) used Use of sine rule can lead to an answer of 124.4(29…) |
| (Bearing =) 125(.03…) – (180 – 120) | M1 | FT ‘their 125(.03…)’ provided a clear attempt seen to use the cosine rule to calculate the angle at the bottom of the triangle |
| = 065 (º) | A1 | Allow an answer of 065.0(3…) (º) An answer of 65 (º) implies M1A0 |
Alternative
7(b) Alternative method:
| Scheme | Mark | Comments |
|---|---|---|
| Allow use of 7.69(06…) for 7.7 Note: Use of sine rule with the angle on the left of the triangle of 13º can lead to a bearing of 064º, if seen please escalate | ||
| (Right side angle =) \(\cos^{-1}\left(\dfrac{7.7^2 + 2.1^2 - 6.3^2}{2 \times 7.7 \times 2.1}\right)\) | M2 | = cos\(^{-1}\)(49/66) or equivalent M1 for
|
| = 42(.06…) (º) | A1 | 42.3(…) (º) if 7.69(06…) used |
| (Bearing =) 180 – (180 – (90 + 180 – 131 – 32) + 42(.06…)) or 180 – (180 – (90 + 17) + 42(.06…)) or 180 – (73 + 42(.06…)) | M1 | FT ‘their 42(.06…)’ provided a clear attempt seen to use the cosine rule to calculate the angle on the right side of the triangle |
| = 065 (º) | A1 | Allow an answer of 065.0(3…) (º) An answer of 65 (º) implies M1A0 |
| Scheme | Mark | Comments |
|---|---|---|
| (Area factor =) 1 – 0.19 OR \(\dfrac{1}{1 - 0.19}\) (= 0.81) (= 1.2345…) | B1 | Or percentage, fraction or ratio equivalent to 0.81 or 1.2345… May be implied in further possibly incorrect working e.g. 33×0.81, 33×(1 – 0.19), 33 – 33×0.19 (=26.73) |
| (Scale factor =) \(\sqrt{1 - 0.19}\) OR \(\sqrt{\dfrac{1}{1 - 0.19}}\) (= 0.9) (= 1.1(1…)) | B1 | Accept a scale factor of 10:9 or 9:10 or equivalents |
| (Length of Tanvi’s map =) \(\sqrt{1 - 0.19}\) × 33 OR 33 ÷ \(\sqrt{\dfrac{1}{1 - 0.19}}\) | M1 | |
| = 29.7 (cm) | A1 | CAO Accept an answer of 30 (cm) from correct working If no marks awarded, SC1 for any one of the following:
|
| Scheme | Mark | Comments |
|---|---|---|
| Tangent drawn at time 20 minutes | M1 | An appropriate tangent resulting in a gradient between 0.04 and 0.1 |
| Idea of increase in y ÷ increase in x | m1 | Differences need to be attempted for both Allow m1A0 if one difference has been incorrectly calculated An attempt may have been made to convert into miles and/or hours |
| Correctly evaluated gradient for their tangent (between 0.04 and 0.1) | A1 | Dependent on M1m1 awarded Allow their correctly evaluated gradient to be a fraction that may include a decimal e.g. 1.3/20 May be embedded within further work Mark final answer |
| \(\dfrac{\text{‘their gradient’} \times 60}{1.6}\) or \(\dfrac{\text{‘their gradient’} \times 5 \times 60}{8}\) or equivalent | M1 | FT ‘their gradient’ provided it’s an increase in y ÷ increase in x from an attempt made at drawing a tangent at time 20 minutes Do not award if previous incorrect attempt/s made at converting one or both differences into miles and/or hours |
| Correctly evaluated speed in mph for ‘their gradient’ (between 1.5 and 3.75 mph) | A1 | Accept appropriate rounding |