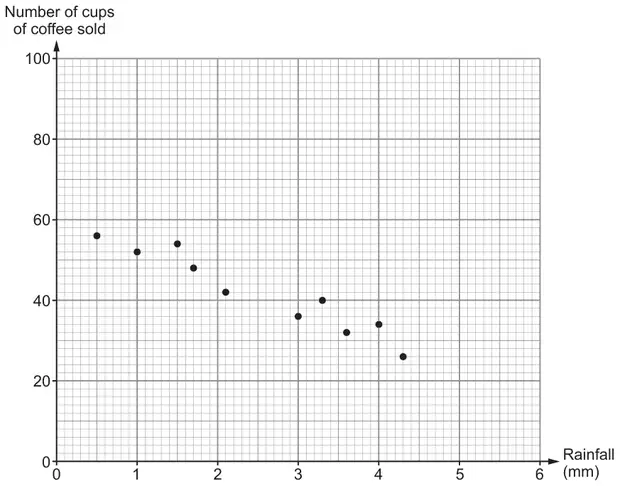
(a) It rained on each of the last 10 days. Each day, Anwen recorded the amount of rainfall and the number of cups of coffee she sold. The scatter diagram below shows her results.For the last 10 days:
the mean number of cups of coffee sold per day was 42
the total rainfall was 25 mm.
(i) Give the coordinates of the point through which a line of best fit should be drawn. Hence, draw a line of best fit on the scatter diagram. [2]
Coordinates of the point are ( …………… , …………… )
(ii) Estimate the number of cups of coffee that Anwen expects to sell on a day when the rainfall is 2·0 mm. Use your line of best fit to find your estimate. [1]
Number of cups of coffee is ……………
(b) Anwen buys her coffee beans in tins. Each tin has a height of 18 cm, correct to the nearest 1 cm.
Calculate the maximum height of a stack of 5 of these tins. [2]
(c) The height of the storage space under Anwen’s serving counter is 97·5 cm, correct to the nearest 0·5 cm.
Anwen is going to buy a recycling bin of height exactly 97·3 cm. Can Anwen be certain that she can fit this bin under her serving counter?
Yes ☐ No ☐ Can’t decide ☐
You must show working to support your answer. [1]
Mark scheme (a)
Scheme
Marks
Comments
(i) (2.5, 42) stated with a suitable line of best fit drawn through this point
B2
For B2 do not ignore the answer space stating an incorrect point, or giving reverse coordinates
Conditions of a suitable line of best fit:
The straight line (accept intention if a ruler is not used) must have points above and below it
The line must be of sufficient length, to illustrate trend for at least 6 points
The trend shows that there are points above and below the line towards each end of the line
For B2 the point (2.5, 42) must be stated or plotted with a suitable line of best fit through this point. If (2.5, 42) is not stated or plotted, then it is only possible to award a maximum of B1
Allow B2 for one of the following:
a blank answer space with (2.5, 42) plotted with a suitable line of best fit through (2.5, 42)
(2.5, 42) stated in the answer space, but not plotted, with suitable line of best fit passing through (2.5, 42)
B1 for sight of any one of the following:
(2.5, 42) stated in the answer space
blank answer space with (2.5, 42) indicated by a correct plot
A suitable line of best fit for the given points:
with no additional point plotted
passing through ‘their additional incorrect point’ (plotted)
suitable if ‘their additional incorrect point’ plotted is ignored
(ii) Reading from line of best fit for number of cups (tolerance to the nearest gridline) for rainfall of 2.0 mm
B1
Answer space takes precedence STRICT FT from (a)(i) ‘their line of best fit’ which must be drawn for negative correlation No mark is awarded if no line of best fit drawn in (a)(i)
Mark scheme (b)
Scheme
Marks
Comments
5 × 18 + 5 × 0.5 or 18.5 × 5
M1
Allow for 18 < ‘their 18.5’ ≤ 19
92.5 (cm)
A1
CAO
If no marks, award SC1 for sight of 18.5 (cm) or 18.4999(... cm) provided clearly a recurring 9 digit
Mark scheme (c)
Scheme
Marks
Comments
Selects or unambiguously implies ‘No’ with a reason, e.g. ’(Space) minimum 97.25 (cm) (which is less than 97.3 cm)’
E1
Allow ‘No’ with a reason, e.g. ‘97.25 (cm)’ ‘(least) 97.25 and (greatest) 97.75’
Do not accept ‘No’ with the reason, e.g. ‘97.75 (cm)’
We'd like to use Google Analytics cookies to count visits and see which pages help most. They're optional, and the site works exactly the same either way. Privacy policy