
Numeracy Higher November 2024 Unit 1 Q11
11. Ravi is driving his car to work.
He brakes sharply to stop at a set of traffic lights.
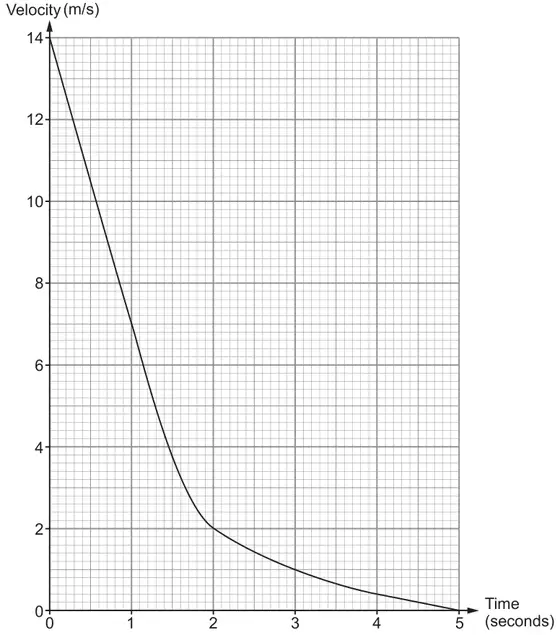
The velocity-time graph below shows the last 5 seconds of his journey before the car stops at the lights.
(a)
(i) Using 5 strips of equal width, calculate an estimate of the distance the car travelled in these 5 seconds. [3]
(ii) Is your answer to part (a)(i) an overestimate or an underestimate?
You must give a reason for your answer. [1]
You must give a reason for your answer. [1]
(b) Estimate the deceleration of Ravi’s car at time 2 seconds.
Give your answer in its simplest form. [3]
Give your answer in its simplest form. [3]
From the formula list: Area of trapezium \(= \dfrac{1}{2}(a+b)h\)
| Scheme | Marks | Comments |
|---|---|---|
| (i) (Area =) \(\frac{1}{2}\) × 1 × (14 + 0 + 2(7 + 2 + 1 + 0.4)) or equivalent | M2 | M1 for at most 1 slip in substitution of values from the velocity axis OR M1 for 1 of the vertical readings omitted with all others correct |
| = 17.4 (m) | A1 | FT from M1 |
Alternative method (a)(i)
| Scheme | Marks | Comments |
|---|---|---|
| (Area =) \(\dfrac{(14 + 7)}{2}\)×1 + \(\dfrac{(7 + 2)}{2}\)×1 + \(\dfrac{(2 + 1)}{2}\)×1 + \(\dfrac{(1 + 0.4)}{2}\)×1 + \(\dfrac{(0.4 + 0)}{2}\)×1 [10.5 + 4.5 + 1.5 + 0.7 + 0.2] | M2 | M1 for the sum of these 5 areas with at most one error (may be repeated) in the substitution of values from the velocity axis OR M1 for the sight of 5 correct areas with the intention to add them (possibly omitting one) |
| = 17.4 (m) | A1 | FT from M1 |
| Scheme | Marks | Comments |
|---|---|---|
| (ii) Overestimate AND valid reason e.g. ‘The trapeziums all extend above the curve’, or ‘The curve is below the area calculated’, or ‘The area of each trapezium is greater than the area under the curve’, or ‘The area of the 2nd trapezium is greater than the area under the curve’ | E1 | Allow Overestimate AND e.g. ‘Does not take into account the curvature of the graph’, or ‘The lines I have drawn are above the curve’ Do not accept e.g. ‘Parts of the graph haven’t been used’ |
| Scheme | Marks | Comments |
|---|---|---|
| Suitable tangent drawn at time 2 seconds | M1 | Tangent needs to go through (2, 2) with no ‘daylight’ between their tangent and the curve |
| Idea of difference in y ÷ difference in x | m1 | If only 1 correct difference seen, then award m1 followed by A0 |
| Correct deceleration from difference in y ÷ difference in x in its simplest form | A1 | Allow a negative value Accept a fully simplified improper fraction (unless it gives a whole number), mixed number or decimal. If they give a decimal, it needs to be correctly evaluated to at least 1 decimal place, rounded or truncated Mark final answer |