
Foundation November 2024 Paper 1 Q11
11. Oliver went for a ride on his bike.
Some of his journey is represented on the distance-time graph below.
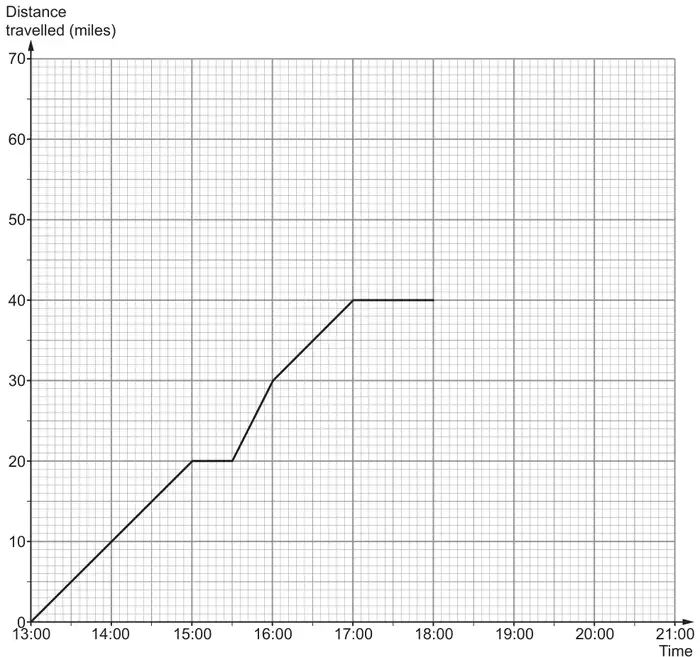
(a) What was Oliver’s average speed between 13:00 and 15:00? [2]
(b) Give an explanation for the shape of the graph between 17:00 and 18:00. [1]
(c) Between which two times was Oliver cycling at the greatest speed? [1]
(d)
Oliver started the final part of his cycle ride at 18:00.
He cycled 20 miles at an average speed of 8 mph.
Draw this part of the cycle ride on the distance-time graph. [2]
| Scheme | Marks | Comments |
|---|---|---|
| (average speed =) 20 ÷ 2 | M1 | |
| 10 (mph) | A1 |
| Scheme | Marks | Comments |
|---|---|---|
Accept suitable explanation e.g.
| E1 | Allow ‘he wasn’t cycling’ OR ‘the distance travelled stayed the same’. E0 for ‘it stayed the same’. |
| Scheme | Marks | Comments |
|---|---|---|
| 15:30 (and) 16:00 | B1 |
| Scheme | Marks | Comments |
|---|---|---|
| Straight line connecting (18:00, 40) and (20:30, 60) | B2 | B1 for either:
|
| (6) |