
Numeracy Foundation November 2023 Unit 1 Q6
6. In a survey, 540 people were asked if they preferred pasta, rice or potatoes.
They were asked to choose just one preference.
The results are displayed in the accurately-drawn pie chart below.
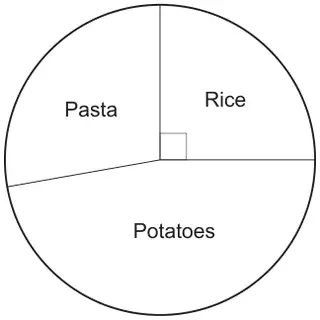
(a)
How many people preferred rice? [2]
…………………… people
(b)
The sector for potatoes on the pie chart is to be split.
40% of the people who chose potatoes said they preferred chips.
What will be the size of the angle in the sector for chips?
You must show all your working. [3]
…………………… °
(c)
540 people took part in the survey. \(\dfrac{7}{10}\) of these people were children.
How many people who took part in the survey were not children? [2]
Number of people who were not children ……………………
| Scheme | Marks | Comments |
|---|---|---|
| \(\dfrac{90}{360}\) × 540 or ¼ × 540 or 540 ÷ 4 or equivalent | M1 | |
| 135 (people) | A1 | Answer space takes precedence When repeatedly halving 540, if there are errors, award M0 A0 unless indication that the intention is to divide by 2, e.g.
|
| Scheme | Marks | Comments |
|---|---|---|
| Angle measured 170(°) ± 2(°) | B1 | May be seen on the pie chart |
| 0.4 × 170(° ± 2°) or equivalent | M1 | FT for ‘their angle, provided 90° < ‘their angle’ < 180° Any method of repeated addition must clearly be addition to 40% |
| 68(°) or angle in the range 67(°) to 69 (°) | A1 | Only allow angles in this range provided not from incorrect working Answer space takes precedence Allow A1 for labelled angle on the pie chart if no final answer given. On FT, using ‘their 170’, allow angles correctly rounded or truncated to the nearest degree |
| Scheme | Marks | Comments |
|---|---|---|
| 540 − \(\dfrac{7}{10}\) × 540 or (1 - \(\dfrac{7}{10}\)) × 540 or \(\dfrac{3}{10}\) × 540 | M1 | For complete method |
| 162 (not children) | A1 | Answer space takes precedence If no marks, award SC1 for sight of (\(\dfrac{7}{10}\) × 540 =) 378 |