
Numeracy Foundation June 2025 Unit 1 Q9
9. On a flight to Spain, the cabin crew started serving drinks to passengers at 11:00 a.m.
The flight manager recorded the length of time each passenger had to wait to be served.
The flight manager has drawn a frequency diagram to display her findings.
She used groups of width 10 minutes:
\(0 \leqslant \text{time} \lt 10\), \(10 \leqslant \text{time} \lt 20\), and so on.
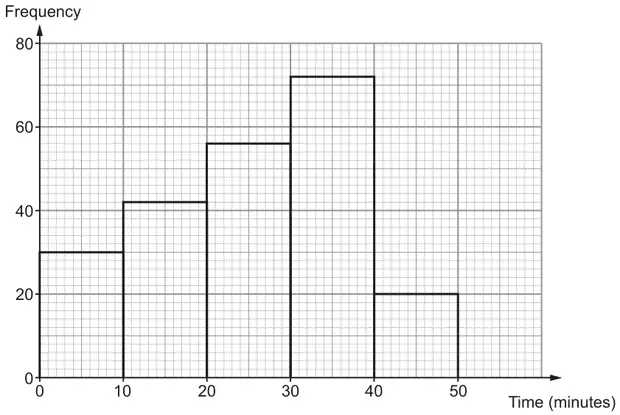
(a) How many passengers waited less than 10 minutes to be served? [1]
(b) How many passengers were on this flight to Spain? [2]
(c) What fraction of the total number of passengers had to wait 40 minutes or more to be served a drink?
Express your answer in its simplest form. [2]
Express your answer in its simplest form. [2]
(d) What is the modal group of these recorded times? [1]
(e)
The flight manager says,
| Consider the passengers who waited between 30 minutes and 40 minutes to be served. If 12 of these passengers had been served 10 minutes faster, the modal group would have been different. |
Is the flight manager correct?
Give a reason for your answer. [1]
Yes ☐ No ☐
| Scheme | Marks | Comments |
|---|---|---|
| 30 (passengers) | B1 |
| Scheme | Marks | Comments |
|---|---|---|
| 30 + 42 + 56 + 72 + 20 | M1 | FT ‘their 30’ + 190 Also allow 1 or 2 slips in the frequencies If no addition shown, allow sight of figures written on the bars or working provided a total of approximately 200 is given or with a convincing total that may come from attempting to add |
| 220 (passengers) | A1 | CAO |
| Scheme | Marks | Comments |
|---|---|---|
| \(\dfrac{1}{11}\) | B2 | FT ‘their 220’ (total) and ‘their 20’ (final frequency), only award B2 if simplification needed, otherwise award B1 B1 for \(\dfrac{20}{220}\) or for not fully simplified equivalent |
| Scheme | Marks | Comments |
|---|---|---|
| 30 ≤ time < 40 | B1 | Accept unambiguous group, e.g. ‘30 to 40’, ‘30<40’ Do not accept 72, 30–40 (=) 72, or a choice of answers Allow B1 for a clear statement that the ‘group (answer) is 30 to 40’ with a statement that the ‘frequency is 72’ |
| Scheme | Marks | Comments |
|---|---|---|
| Indicates or states ‘Yes’ with a reason, e.g. ‘20 to 30 minutes would be 68 (passengers) and 30 to 40 minutes would be 60 (passengers)’, ‘It would be 68 passengers and 60 passengers’ | E1 | Allow ‘Yes’ ignoring incorrect frequencies stated provided the reason clearly showing understanding that 20 to 30 minutes would now be the ‘tallest bar’ or have the ‘greatest frequency’ or have the ‘most passengers’ Allow ‘Yes’ with a reason, e.g. ‘20 to 30 minutes would (now) be the tallest bar’, ‘because the 12 would be in the 20-30 making it 68’, ‘20 to 30 minutes would (now) be 68 passengers’, ‘30 to 40 minutes would (now) be 60 passengers’, ‘there would be more people in 20 to 30 minutes than the 30 to 40 minutes’ Do not accept ‘Yes’ with an incomplete reason e.g. ‘It would be 68 passengers’, ‘It would be 60 passengers’, ‘the 20 to 30 minute group would have been faster’, ‘because the modal group would have changed if the 12 passengers had been served 10 minutes faster’, ‘it would fall into a different time slot’, ‘modal group 20-30, while 30-40 goes down’, ‘there would be more people in 20 to 30 minutes’, ‘there would be more people’ |