
Foundation June 2025 Unit 2 Q15
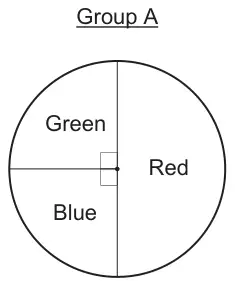
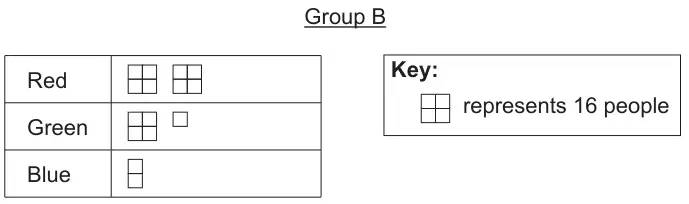
15. Two groups of people, Group A and Group B, took part in Adam’s survey.
Adam asked each person this question:
“From the colours Red, Blue and Green, which is your favourite colour?”
There are 92 people in Group A.
The results for Group A are shown in the pie chart below.
The results for Group B are shown in the pictogram below.
Adam chose one person at random from all the people in both groups.
What is the probability that this person chose Green? [5]
| Scheme | Marks | Comments |
|---|---|---|
| (Group A Green = 92 ÷ 4 =) 23 (people) | B1 | Answers may be seen on diagrams. May be implied or seen in later working. |
| (Group B Green = 5 × 4 =) 20 (people) | B1 | May be implied or seen in later working. |
| (Total number of people = 92 + 32 + 20 + 8 or 92 + 15 × 4 = ) 152 | B2 | May be implied or seen in later working. (= 92 + 60) For B2, FT for any one of the following:
|
| (Probability of choosing Green =) \(\dfrac{43}{152}\) or equivalent ISW | B1 | (= 28.2(89…)% or 0.282(89…)) If answer is shown as a fraction, it must be simplified as a single fraction. Allow rounded or truncated answer for the decimal or percentage, provided 28.2(89…)% or equivalent has been seen. FT \(\dfrac{\text{‘their 23 + ‘their 20’}}{\text{‘their derived 152’}}\) , provided < 1. Penalise incorrect notation −1. e.g. ‘43 in 152’. |