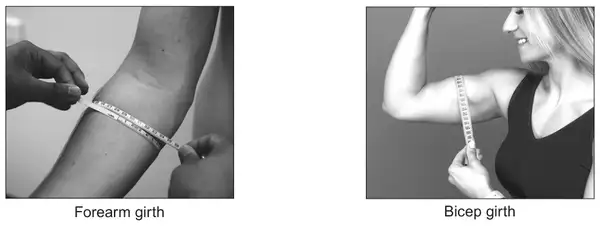
3. Awena has a large data set of body measurements, and she wants to investigate relationships between body dimensions. In this particular investigation, she is testing for a correlation between forearm girth and bicep girth. The diagrams below show how to measure these.
(a) Why is it appropriate for Awena to use a one-tailed test? [1]
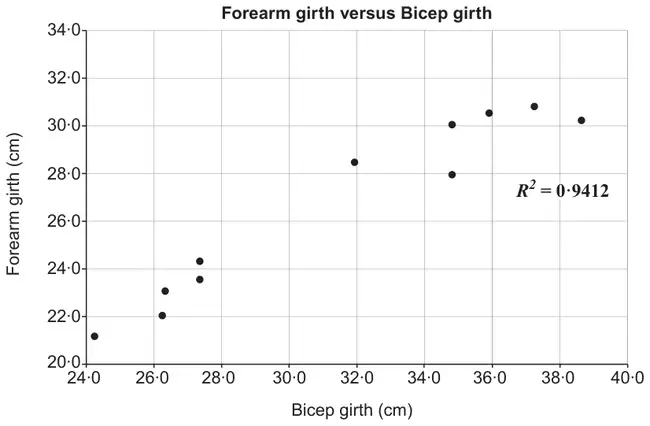
Awena takes a random sample of size 11 from her data set and plots the following scatter diagram.
(b) Using the computer output above, carry out a one-tailed significance test on the sample product moment correlation coefficient at the 0·5% level. [5]
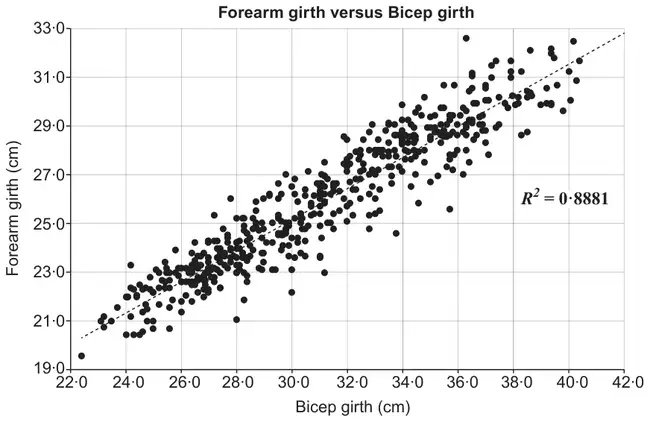
(c) Blodwen also has access to the same large data set. She decides to do the same test using all of the 507 available data points. Her results are shown below.
(i) State the problem Blodwen will encounter when attempting to use statistical tables for her test.
(ii) How should Blodwen deal with this problem? [2]
Mark scheme (a)
Scheme
Marks
Comments
Valid reason, e.g.,
It is obvious that, in the general population, people with bigger biceps would have bigger forearms.
It is very unreasonable to think that people with bigger forearms have smaller biceps in general.
No need to check for negative correlation.
She knows there will be some kind of positive correlation.
E1
Condone “negative correlation is impossible.”
E0 for the diagram shows positive correlation. E0 for “it should be a two-tailed test.” E0 for “specifically looking for a positive or negative correlation” (both positive and negative stated). E0 for implying a causal relationship, e.g. “increase in forearm girth will cause an increase in bicep girth”.
[1]
Mark scheme (b)
Scheme
Marks
Comments
(Let \(\rho\) denote the population correlation coefficient between forearm girth and bicep girth.) \(H_0\colon\rho=0\) \(H_1\colon\rho\gt 0\)
B1
Allow other letters if defined. Allow worded hypotheses
B0 for \(H_0\): correlation = 0. Population must be stated or implied. B0 for omission of \(\rho\) or use of \(r\) B0 for a non-strict inequality in \(H_1\)
TS \(\left(=\sqrt{0.9412}\right)=0.97015\ldots\)
B1
Labelled as TS or used in correct comparison with a critical value (not with significance level). B0 for \(r=0.97015\) without label as TS or used in comparison. B0 for \(TS=\pm 0.97015\) unless the positive value correctly used later.
CV = 0.7348
B1
B0 for 0.7545 from Spearman’s rank. Condone 0.7348 stated as the CV even if using a two-tailed test.
Since 0.970 > 0.7348 (there is sufficient evidence to) Reject \(H_0\).
B1
FT for using 0.9412 and their CV. (Comparison may be implied by a diagram.)
Sufficient evidence to suggest there is a positive correlation between bicep girth and forearm girth.
E1
cso Do not allow categorical statements
E0 for omission of the word positive (unless positive implied by contextualised comment, e.g. E1 for sufficient evidence to suggest that the bigger the bicep girth the bigger the forearm girth.)
[5]
Mark scheme (c)
Scheme
Marks
Comments
(i) Her \(n\) is not in the table.
E1
oe Condone “likely not in the table”.
(ii) Valid comment, e.g.
Use a software package to carry out the test.
Use a software package to find the CV.
Use a software package to find the p-value.
Realise that the CVs are lower than those for \(n=100\) in the tables.
Realise that there is no need to carry out a test for correlation when the scatter diagram clearly shows very strong correlation (and is bivariate normal).
E1
Condone “Use an online table that goes to 507.” Allow “Use a calculator to find the CVs.” E0 for “use the calculator” without reference to a possible use of the calculator (e.g. find the CV). E0 for “use a smaller sample size.” E0 for “take a sample so that you can use tables.” Allow “work out critical values using a t-distribution.”
We'd like to use Google Analytics cookies to count visits and see which pages help most. They're optional, and the site works exactly the same either way. Privacy policy