
AS June 2024 Further Unit 2 Q4
4. An author poses the following question:
Does using cash for transactions affect people’s financial behaviour?
She collects data on ‘Cash transactions as a % of all transactions’ and ‘Household debt as a % of net disposable income’ from a random sample of 25 countries. The table below shows the data she collected. There are missing values, \(p\) and \(q\), for Malta and Denmark respectively.
| Country | Cash transactions as a % of all transactions \(x\) | Household debt as a % of net disposable income \(y\) | Country | Cash transactions as a % of all transactions \(x\) | Household debt as a % of net disposable income \(y\) |
|---|---|---|---|---|---|
| Malta | 92 | \(p\) | France | 68 | 120 |
| Mexico | 90 | –14 | Luxembourg | 64 | 177 |
| Greece | 88 | 107 | Belgium | 63 | 113 |
| Spain | 87 | 110 | Finland | 54 | 137 |
| Italy | 86 | 87 | Estonia | 48 | 82 |
| Austria | 85 | 91 | The Netherlands | 45 | 247 |
| Portugal | 81 | 131 | UK | 42 | 147 |
| Slovenia | 80 | 56 | Australia | 37 | 214 |
| Germany | 80 | 95 | USA | 32 | 109 |
| Ireland | 79 | 154 | Sweden | 20 | 187 |
| Slovakia | 78 | 74 | South Korea | 14 | 182 |
| Lithuania | 75 | 46 | Denmark | \(q\) | 261 |
| Latvia | 71 | 43 |
The summary statistics and scatter diagram below are for the other 23 countries.
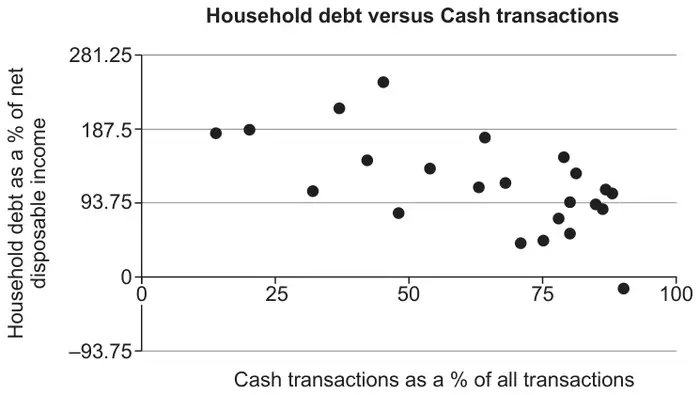
(a) Using the summary statistics for the 23 countries, calculate and interpret Pearson’s product moment correlation coefficient. [3]
(b) Calculate the equation of the least squares regression line of Household debt as a % of net disposable income (\(y\)) on Cash transactions as a % of all transactions (\(x\)). [5]
The regression line \(x\) on \(y\) is given below.
\[x=-0{\cdot}24y+91{\cdot}92\](c) By selecting the appropriate regression line in each case, estimate the values of \(p\) and \(q\) in the table. [2]
(d) Comment on the reliability of your answers in part (c). [1]
(e) Interpret the negative value of \(y\) for Mexico. [1]
| Scheme | Marks | Comments |
|---|---|---|
| \(r=\dfrac{-18895.13043}{\sqrt{11503.91304\times78669.30435}}\) | M1 | Condone +ve numerator |
| \(r=-0.628\) | A1 | 3sf |
| Valid interpretation. e.g. The negative value of 0.628 implies that on average the more people rely on cash, the less debt they have as a proportion of their household income. e.g. The correlation is fairly strong between household debt and the use of cash for transactions. e.g. As the percentage of cash transactions increases, net household debt as a percentage of disposable income tends to decrease. e.g. Household debt and percentage of cash transactions are negatively correlated. | E1 | |
| [3] |
| Scheme | Marks | Comments |
|---|---|---|
| \(b=\frac{S_{xy}}{S_{xx}}\) | M1 | |
| \(b=-1.64\) | A1 | |
| \(a=\dfrac{2695}{23}+1.6424959\ldots\times\dfrac{1467}{23}\) | M1 | FT their \(b\) for M1A0 |
| \(a=221.9\ldots\) | A1 | |
| \(y=222-1.64x\) | B1 | Correct to 3sf, ft their \(a\) and \(b\) |
| [5] |
| Scheme | Marks | Comments |
|---|---|---|
| Selecting correct equation to use in each case. | FT (b) for Malta | |
| Malta \(p=222-1.64\times92\) \(p=71.12\) | B1 | Accept anything rounding to 71 |
| Denmark \(q=-0.24\times261+91.92\) \(q=29.28\) | B1 | |
| [2] |
| Scheme | Marks | Comments |
|---|---|---|
| Valid explanation e.g. Not reliable because it’s extrapolation, rather than interpolation. e.g. May not be reliable because the values are very close to the extremes of the graph. e.g. May be reliable because there is fairly strong correlation and the values are only just outside the range of the graph. | E1 |
| Scheme | Marks | Comments |
|---|---|---|
| Valid explanation. e.g. Net disposable income may be negative. e.g. Household incomes are less than outgoings leading to a negative value for net disposable income. e.g. Maybe an erroneous value. | E1 | |
| [2] | ||
| Total for Question 4 | 12 |