
June 2025 Unit 4 Q3
3. A city councillor is investigating the decline in the number of bus drivers in the city. During her research, she finds an article claiming that delivery companies are actively recruiting bus drivers to work for them.
She collects data on the number of bus drivers and the number of delivery drivers from 8 randomly selected cities of a similar size to her city. She calculates the correlation coefficient in order to carry out a hypothesis test.
(a) Explain why a one-tailed test could be appropriate. [1]
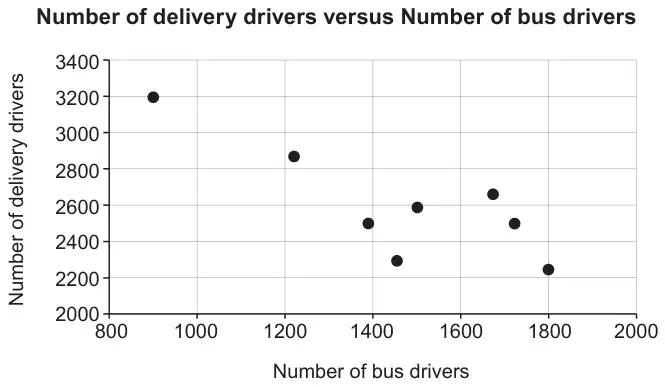
The product moment correlation coefficient for the data is \(-0{\cdot}8206\).
(b) Carry out a one-tailed significance test at the 5% significance level. [5]
(c)
(i) Suggest a reason why the city councillor might conclude that there is a causal link between the number of delivery drivers and the number of bus drivers.
(ii) What can the city councillor conclude about the recruitment of bus drivers by delivery companies over time? [2]
| Scheme | Marks | Comments |
|---|---|---|
| Valid explanation e.g. The councillor is concerned about the decline of bus drivers being linked with an increase of delivery company drivers. | E1 | For E1 must address decrease in bus drivers and increase in delivery drivers. Accept E1 Specifically looking for negative correlation. E1 Likely to be negative correlation. E0 Graph shows negative correlation. E0 Claim only talks about the decline, a negative statement. If it was research about positive or negative it would be 2-tailed. E0 Councillor is concerned about the decline of bus drivers. |
| [1] |
| Scheme | Marks | Comments |
|---|---|---|
| \(H_0:\rho=0\qquad H_1:\rho<0\) | B1 | B0 for \(H_0\): correlation = 0. Population must be stated or implied. B0 for omission of \(\rho\) or use of \(r\). B0 for non-strict inequality. |
| \(\text{TS}=-0.8206\) | B1 | B1 Labelled as test statistic or used in comparison with a critical value (not a significance level). If positive, only award once compared with \(0.6215\). |
| \(\text{CV}=(\pm)0.6215\) | B1 | |
| Since \(|\text{TS}|>0.6215\) (or \(-0.8206<-0.6215\)), there is sufficient evidence to reject \(H_0\). | B1 | Must account for \(-\) at some point. e.g. \(-0.8206<0.6215\) is B0 FT their CV. Comparison may be implied by a diagram. |
| There is evidence to suggest that there is negative correlation between the number of delivery drivers and the number of bus drivers. | E1 | cso Must have context. |
| [5] |
| Scheme | Marks | Comments |
|---|---|---|
| (i) Valid reason. e.g. There is only a limited number of drivers so a delivery company could offer more money to a driver and then that would lead to a decrease in bus drivers. e.g. Bus driver is becoming a less attractive job and delivery driver is becoming a more attractive job. e.g. Conditions of work may be better as a delivery driver compared to those of a bus driver. | E1 | E1 Better job/pay/hours as a delivery driver. E0 Number of bus drivers and delivery drivers are connected. E0 for stating there is a causal link because bus drivers are becoming delivery drivers. |
| (ii) Valid reason. e.g. The city councillor cannot reach any conclusion because she does not have any data over time. She only has a snapshot at one point in time for 8 cities. | E1 | |
| [2] | ||
| [8] | Total for Question |