
June 2023 Unit 4 Q5
5. A medical researcher is investigating possible links between diet and a particular disease. She selects a random sample of 22 countries and records the average daily calorie intake per capita from sugar and the percentage of the population who suffer from this disease.
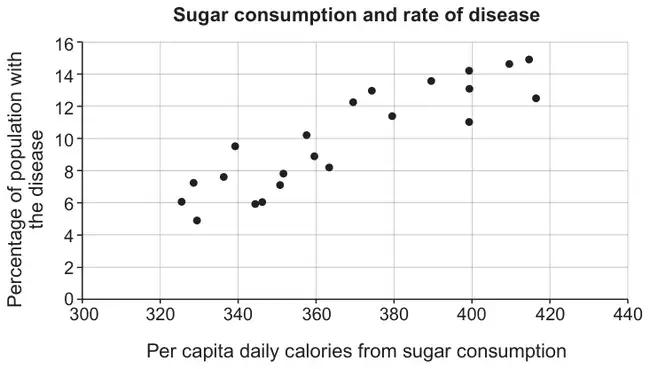
There are 22 data points and the product moment correlation coefficient is 0·893.
(a) Stating your hypotheses clearly, show that these data could be used to suggest that there is a link between the disease and sugar consumption. [5]
The medical researcher realises that her data is from the year 2000. She repeats her investigation with a random sample of 13 countries using new data from the year 2020. She produces the following graph.
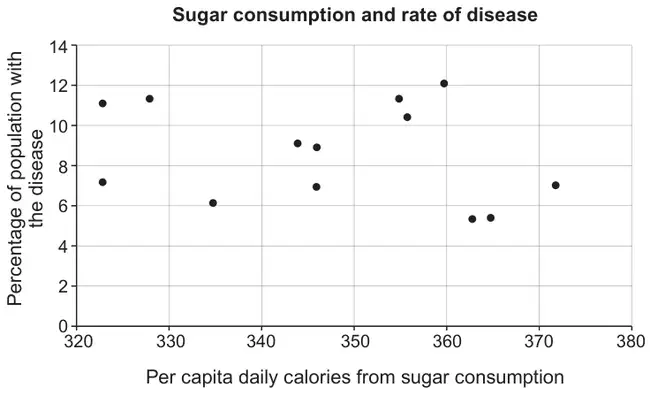
(b) How should the researcher interpret the new data in the light of the data from 2000? [2]
| Scheme | Marks | Comments |
|---|---|---|
| (Let \(\rho\) denote the population correlation coefficient between per capita daily calories from sugar consumption and percentage of the population with the disease.) \(H_0:\rho=0\qquad H_1:\rho\neq 0\) | B1 | Allow other letters if defined. Allow worded hypotheses provided the population is stated or implied. B0 for \(H_0\): correlation = 0. Population correlation must be stated or implied. B0 for omission of \(\rho\), or \(r\) in place of \(\rho\). B0 for a one-tailed test. |
| \(\mathrm{TS}=0.893\) | B1 | Labelled as TS or used in correct comparison |
| CV = (\(\pm\)) 0.5368 (at the 1% level) (CR is \(R\lt -0.5368\) or \(R\gt 0.5368\)) | B1 | Accept use of different significance levels. OR Award this mark for stating “the test statistic is greater than all critical values”. |
| Since \(\mathrm{TS}\gt\ 0.5368\), there is sufficient evidence to reject \(H_0\). | B1 | FT their CV. Correct comparison required (may be implied through a diagram). |
| This suggests that there is a link between the disease and sugar consumption. | E1 | CSO Do not allow categorical statements (condone categorical statements if “sufficient evidence” seen in m1 statement). Statement must match two tailed hypothesis. E0 for a one-tailed conclusion, e.g. there is evidence of a positive correlation between… |
| Scheme | Marks | Comments |
|---|---|---|
| Valid comment on correlation in 2000 and 2020. e.g. Although there is (evidence of) a (strong) positive correlation in 2000 there seems to be no correlation in 2020. | E1 | |
| Valid comment on the ambiguity of the studies. e.g. This would imply that sugar consumption is only coincidentally correlated with the disease in 2000. e.g. There must be a different cause for the disease other than sugar. e.g. \(n\) is too small to make meaningful comparisons. e.g. different samples lead to different conclusions, which may explain the difference. e.g. the link between the disease and sugar consumption has diminished over the 20 years. | E1 | E1 for identifying a drawback of the conclusions or identifying a reason for the change. E0 for “this is because there is no link between the disease and sugar consumption” without substantiating with a valid reason. |
| OR Valid comment on third factor correlated with sugar consumption and the disease in 2000 no longer relevant in 2020. e.g. An additive may have been added to many products containing sugar in 2000 which was contributing to the prevalence of the disease but has been banned by 2020. e.g. Advancements in medical care for the disease from 2000 to 2020 are likely to explain the change in relationship. | (E2) | E1 for correctly identifying a possible confounding variable. E1 for explaining why this may lead to the change in relationship seen. |
| Total [7] |
Corrected by Westie's Workshop
- The board's mark scheme printed “would substantiating”. Changed to “without substantiating” because “would” does not make sense there; the sentence means a bare claim with no valid reason gets E0.
Original: see the board's mark scheme PDF (link above).