
June 2025 Unit 2 Q5
5. The World Health Organisation (WHO) compiles data on life expectancy and other factors.
A hobbyist statistician is exploring the data he collects from the WHO. The following screenshot shows part of his work.
| Country | Life expectancy | Adult mortality | Hepatitis B | Polio | GDP | Population | Years of schooling | Life expectancy |
|---|---|---|---|---|---|---|---|---|
| Benin | 60 | 249 | 82 | 78 | 784 | 13 958 086 | 10·7 | 60 |
| Botswana | 65·7 | 256 | 95 | 96 | 6533 | 2 705 113 | 12·6 | 65·7 |
| Comoros | 63·5 | 227 | 91 | 92 | 728 | 777 424 | 11·1 | 63·5 |
| Costa Rica | 79·6 | AB | 92 | 92 | 1146 | 5 235 470 | 14·2 | 79·6 |
| Saudi Arabia | 74·5 | 88 | 98 | 97 | 2733 | 16·1 | 74·5 | |
| Seychelles | 73·2 | 168 | 98 | 97 | 1539 | 93 419 | 14·1 | 73·2 |
(a) Give two ways in which the data could be cleaned. [2]
The graph below shows the life expectancy and years of schooling for 16 randomly selected countries.
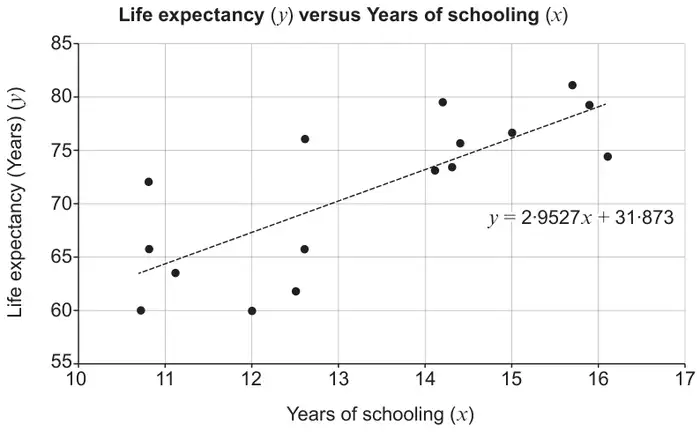
(b) Interpret the gradient of the regression line in context. [1]
(c) Comment on the causal nature or otherwise of the correlation. [1]
(d)
(i) Calculate an estimate of the life expectancy for a country that has 14·6 years of schooling. [1]
(ii) Comment on the reliability of your answer. [1]
The entire data set was used to produce the following scatter diagram.
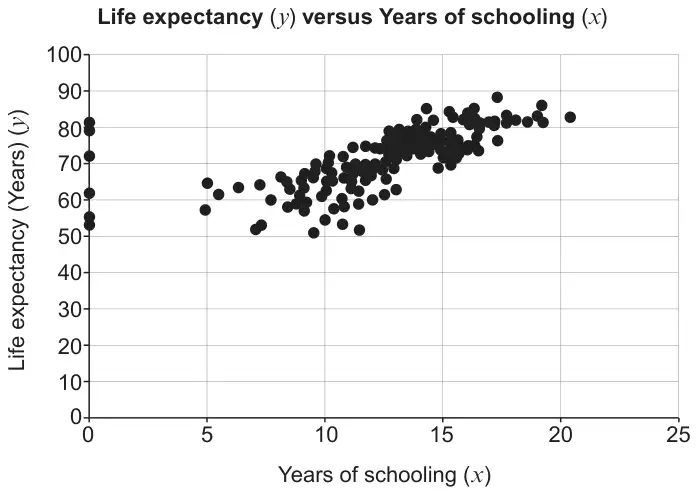
(e) State the curious feature of the graph and what might be done about it. [1]
(f) The summary data for life expectancy, \(y\), in years, for the entire data set are given as follows.\[\sum y=13\,105{\cdot}9 \qquad \sum y^2=950\,615{\cdot}47 \qquad n=183\]
(i) Show that the mean is 71·6 years, correct to 3 significant figures, and calculate the standard deviation. [3]
(ii) The hobbyist statistician claims that 71·6 years represents average global life expectancy. Comment on this claim. [1]
| Scheme | Marks | Comments |
|---|---|---|
| Valid way to clean data. e.g. Population figure for Saudi Arabia could be found. e.g. Add the population figure for Saudi Arabia. e.g. AB in the Adult Mortality column for Costa Rica is clearly incorrect. This could be found out or the data could be ignored, depending on the context. e.g. Remove duplicate columns. e.g. Check the accuracy of the 60 figure for Benin. e.g. Check the Polio figure for Benin. e.g. Investigate to see if polio in Benin is an outlier. | E2 | E1 each correct one. Do not allow ‘Don’t use Saudi Arabia’ or ‘Don’t use Costa Rica’ unless justified e.g. ‘Finding the Adult mortality for Costa Rica might be difficult.’ E0 for ‘should use percentages’. E0 for ‘round to \(X\) significant figures’. E0 for ‘don’t use decimals.’ E0 for ‘group diseases together’. E0 for ‘polio in Benin is an outlier therefore ignore it’. E0 for ‘Use same number of significant figures for all data’. E0 for referencing lack of units. |
| [2] |
| Scheme | Marks | Comments |
|---|---|---|
| For each additional year of schooling, the life expectancy goes up 2.95 (or 3) years on average. | E1 | |
| [1] |
| Scheme | Marks | Comments |
|---|---|---|
| Valid comment. e.g. It could be causal. More education is likely to lead to better life choices and thus increases life expectancy. e.g. There may be a third factor like wealthy countries are likely to have more education and also better access to health care. | E1 | E0 for ‘life expectancy and schooling don’t correlate’. |
| [1] |
| Scheme | Marks | Comments |
|---|---|---|
| (i) \(y=2.9527\times 14.6+31.873=74.98\ (\text{or } 75)\) | B1 | B1 for 74.98. B1 for 75 with correct calculation. B0 for 75 with no calculation. |
| (ii) Valid comment E.g. Likely to be reasonably reliable because 14.6 is within the range of the data and the pattern of the data seems to be roughly linear. e.g. Reliable because we’re interpolating. | E1 | Condone without ‘roughly linear’. E0 for unreliable. E0 for ’75 is within the range of the data.’ E0 sample is too small. |
| [2] |
| Scheme | Marks | Comments |
|---|---|---|
| Valid comment. Eg. There seems to be lots of countries with 0 years of schooling. This is unlikely to be accurate. One could either ignore the data in any analysis or further research could be carried out to find the number of years of schooling for the countries with the missing data. | E1 | |
| [1] |
| Scheme | Marks | Comments |
|---|---|---|
| (i) \(\bar{y}=\dfrac{13105.9}{183}\ (=71.6)\) ag | B1 | Convincing |
| \(\sigma=\sqrt{\dfrac{950615.47}{183}-\left(\dfrac{13105.9}{183}\right)^2}\) | M1 | M1A1 for use of calculator |
| \(\sigma=8.101\) | A1 | Accept answers rounding to 8.1, 8.2, 8.3, 8.25 Accept calculation of \(s=\sqrt{\dfrac{1}{182}\left(950615.47-\dfrac{13105.9^2}{183}\right)}=8.1237\ldots\) M1A1 |
| [3] | ||
| (ii) Valid comment Eg. The mean should be weighted by country population size. | E1 | E0 ‘May not include all countries of the world.’ E0 Only a small number/handful of countries. E0 I support this claim. E0 Shows life expectancy of people who didn’t go to school. E0 for implying we need to take into account the whole population. E0 for should use median or mode. |
| [1] | ||
| Total for Question | 11 |