
October 2020 Paper 2 Q11
11 The pre-release material contains information concerning median house prices over the period 2004 – 2015. A spreadsheet has been used to generate a time series graph for two areas: the London borough of “Barking and Dagenham” and “North West”. This is shown together with the raw data in Fig. 11.1.
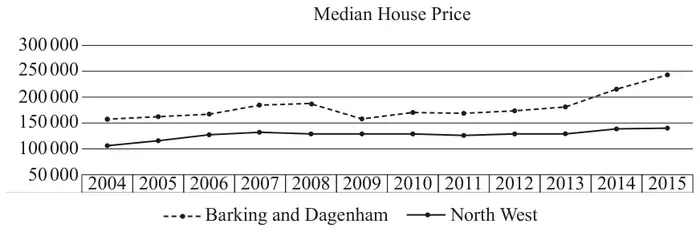
| Year | Barking and Dagenham | North West |
|---|---|---|
| 2004 | 160 000 | 107 000 |
| 2005 | 163 000 | 118 000 |
| 2006 | 168 000 | 127 000 |
| 2007 | 185 000 | 134 750 |
| 2008 | 190 000 | 129 950 |
| 2009 | 160 000 | 130 000 |
| 2010 | 171 000 | 130 000 |
| 2011 | 170 000 | 127 000 |
| 2012 | 174 995 | 130 000 |
| 2013 | 180 995 | 131 000 |
| 2014 | 215 000 | 138 500 |
| 2015 | 243 500 | 140 000 |
Fig. 11.1
Dr Procter suggests that it is unusual for median house prices in a London borough to be consistently higher than those in other parts of the country.
Dr Procter wishes to predict the median house price in Barking and Dagenham in 2016. She uses the spreadsheet function LINEST to find the equation of the line of best fit for the given data. She obtains the equation
\(P = 4897Y - 9\,657\,847\), where \(P\) is the median house price in pounds and \(Y\) is the calendar year, for example 2015.
- 2016
- 2017.
Professor Jackson uses a simpler model by using the data from 2014 and 2015 only to form a straight-line model.
- 2016
- 2017.
Professor Jackson carries out some research online. She finds some information about median house prices in Barking and Dagenham, which is shown in Fig. 11.2.
| 2016 | 2017 |
| £290 000 | £300 000 |
- Dr Procter’s model fits the data,
- Professor Jackson’s model fits the data.
| Scheme | Marks | AO |
|---|---|---|
| house prices are generally higher in London boroughs (than elsewhere in the country), so Dr Procter’s suggestion is probably wrong | B1 | 2.2a |
| [1] |
| Scheme | Marks | AO |
|---|---|---|
| 214 505 | B1 | 3.4 |
| 219 402 | B1 | 1.1 |
| [2] |
| Scheme | Marks | AO |
|---|---|---|
| \(P = 28\,500Y - 57\,184\,000\) (where \(Y\) is the calendar year) | B1 | 3.3 |
| or \(P = 28\,500y + 215\,000\) (where \(y\) is the number of years after 2014) | B1 | 1.1 |
| [2] |
Notes
B1: gradient
B1: intercept
allow both marks for correct equation in any form isw
allow eg \(y = 28\,500x - 57\,184\,000\)
| Scheme | Marks | AO |
|---|---|---|
| 2016 272 000 | B1 | 3.4 |
| 2017 300 500 | B1 | 1.1 |
| [2] |
Notes
FT their straight line model provided this gives values > 250 000
| Scheme | Marks | AO |
|---|---|---|
| Dr Procter’s model is a (very) poor fit | B1 | 2.2a |
| Prof Jackson’s is a good fit, or works well for 2017, but not 2016 | B1 | 2.2a |
| [2] |
Notes
B1: dependent on correct values in (b)
B1: FT comment for their values > 250 000
this mark is dependent on having calculated values in part (d)
| Scheme | Marks | AO |
|---|---|---|
| neither – extrapolation oe | B1 | 3.5b |
| [1] |