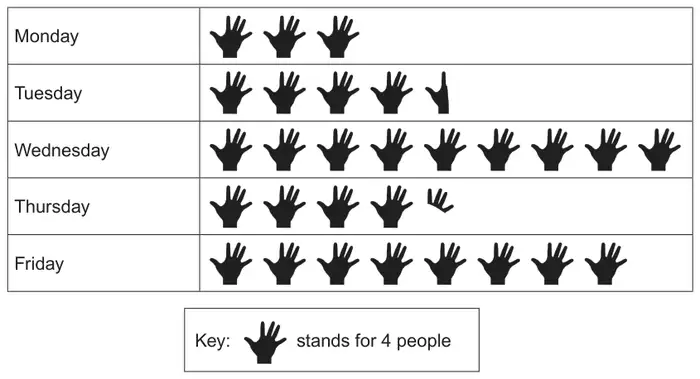
The pictogram represents the number of people using a breakfast club on certain weekdays.
Comment on the design of this pictogram. [1]
(b)
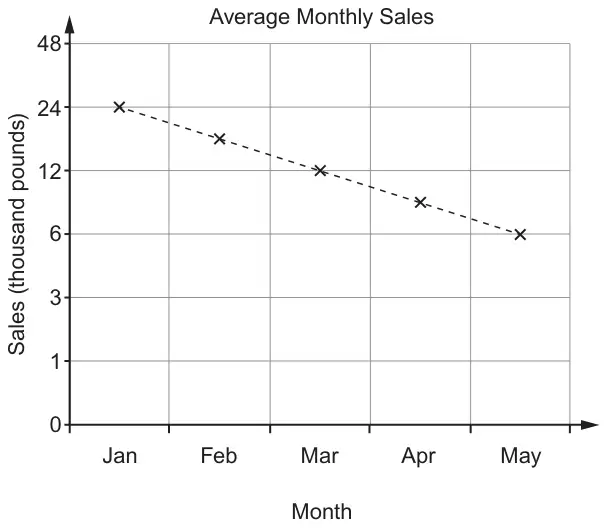
The line graph shows the trend of the average monthly sales of a toy company in thousands of pounds.
(i)
A deliberate error has been made when drawing this line graph.
Explain what error has been made. [1]
(ii) Comment on the impact of this error. [1]
Mark scheme (a)
Scheme
Marks
Comments
Valid comment. e.g. ‘The symbol used cannot easily be divided into 4 equal pieces as required.’ or ‘It is not clear how many people came on Tuesday and Thursday.’
E1
Allow e.g. ‘The pictogram uses a hand with 5 fingers but it only stands for 4 people.’ or ‘The key is not a clear representation of 4 people.’ or ‘The two pictures that are to represent half of the people are different.’
Mark scheme (b)
Scheme
Marks
Comments
(i) Comment about the non-uniform vertical scale e.g. ‘The vertical scale is not evenly spaced’
E1
Allow e.g. ‘The scale as it goes 1 to 3 and then 6.’
(ii) Valid impact e.g. ‘The drop in sales looks less than it actually is.’ or ‘It makes the sales look better than they were.’
We'd like to use Google Analytics cookies to count visits and see which pages help most. They're optional, and the site works exactly the same either way. Privacy policy