
Higher June 2018 Paper 2 Q22
22. A number of girls and boys with part-time jobs answered an online survey.
One of the questions asked how long they each spent working last Friday.
Histograms of these results are shown below.
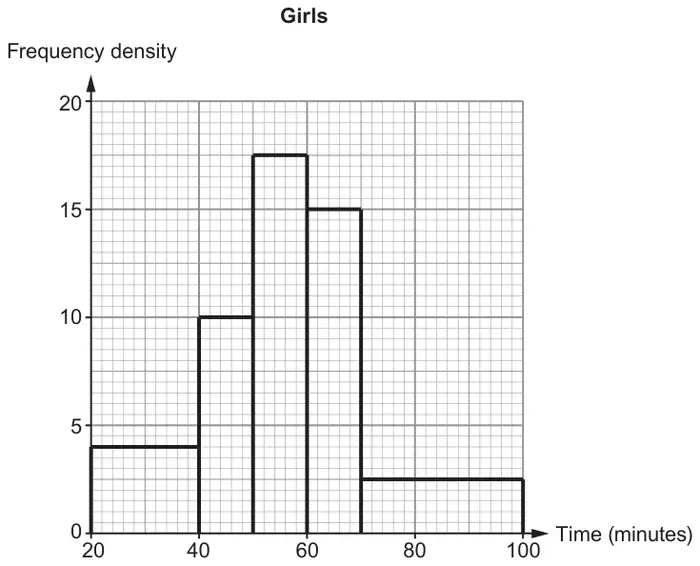
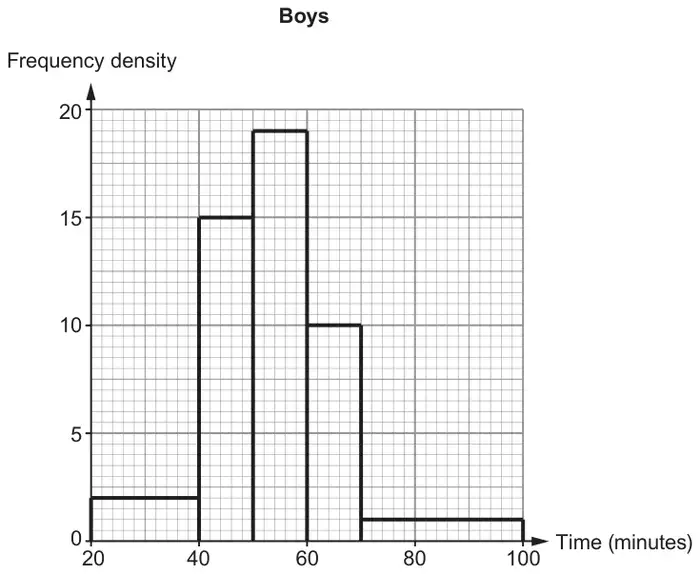
(a) Calculate an estimate for the number of girls who worked for 45 minutes or less last Friday. [2]
(b) Fred uses the results of the survey to compare the percentages of girls and boys who worked 1 hour or more last Friday.
580 girls took part in the survey.
Complete the following statement.
………………… % of girls compared with ………………… % of boys worked for 1 hour or more last Friday. [6]
580 girls took part in the survey.
Complete the following statement.
………………… % of girls compared with ………………… % of boys worked for 1 hour or more last Friday. [6]
| Scheme | Marks | Comments |
|---|---|---|
| \(20\times4 + \tfrac12\times10\times10\) | M1 | |
| 130 (girls) | A1 | CAO |
| Scheme | Marks | Comments |
|---|---|---|
| Total boys: \(20\times2+10\times15+10\times19+10\times10+30\times1\) | M1 | Allow for sight of any three correct products in a sum of 5 products |
| Boys 510 | A1 | |
| >1hour: Girls 225 and Boys 130 | B2 | CAO B1 for one correct total |
| %: Girls \((100\times)\ 225/580\), OR Boys \((100\times)\ 130/510\) | M1 | FT provided M1 previously awarded |
| In order: 38.79.…(%) and 25.49…(%) | A1 | FT provided M1 and at least B1 previously awarded Mark final answer, in answer space if completed. Accept 38.8(%) or 39(%) and 25.5(%) or 25(%) Do not accept as final answers 38(%) or 38.7(%) and 25.4(%) or 26(%), i.e. any rounding must be correct |
| (8) |