
Higher November 2023 Paper 1 Q28
28. Sofia’s dog is running through a field.
Its speed at \(t\) seconds is \(w\) metres per second.
The diagram below shows the speed of the dog for part of its run.
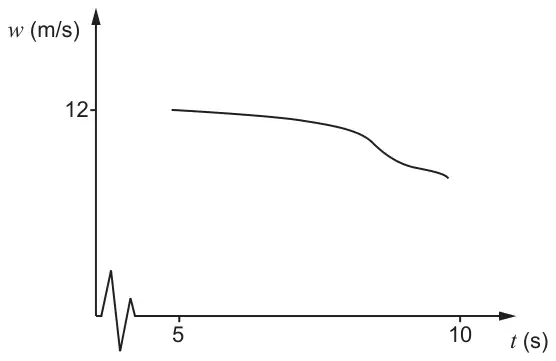
Diagram not drawn to scale
When \(t = 5\), \(w = 12\).
The average deceleration of the dog between 5 and 10 seconds is 1·5 m/s2.
Calculate the speed of Sofia’s dog when \(t = 10\).
You must show all your working. [3]
| Scheme | Marks | Comments |
|---|---|---|
| \(\dfrac{12 - w}{10 - 5}\) or \(\dfrac{w - 12}{10 - 5}\) | S1 | |
| \(\dfrac{w - 12}{10 - 5} = -1.5\) or \(\dfrac{12 - w}{10 - 5} = 1.5\) | M1 | Implies S1 Allow for \(\dfrac{w - 12}{10 - 5} = 1.5\) |
| \(w = 4.5\) (m/s) | A1 | CAO An answer of \(w = 19.5\) is awarded S1 M1 A0 provided no incorrect working seen. |
| (3) |
Alternative method
| Scheme | Marks | Comments |
|---|---|---|
| Use of \(v = u + at\) with \(u = 12\), \(a = -1.5\), \(t = 5\) | S1 | Allow S1 and M1 for use of \(a = 1.5\) |
| \(12 - 1.5\times5\) | M1 | Implies S1 |
| \(w = 4.5\) (m/s) | A1 | CAO |