
4400 Higher November 2005 Paper 3 Q12
12 The cumulative frequency graph gives information about the ages of people in India.
The cumulative frequency is given as a percentage of all the people in India.
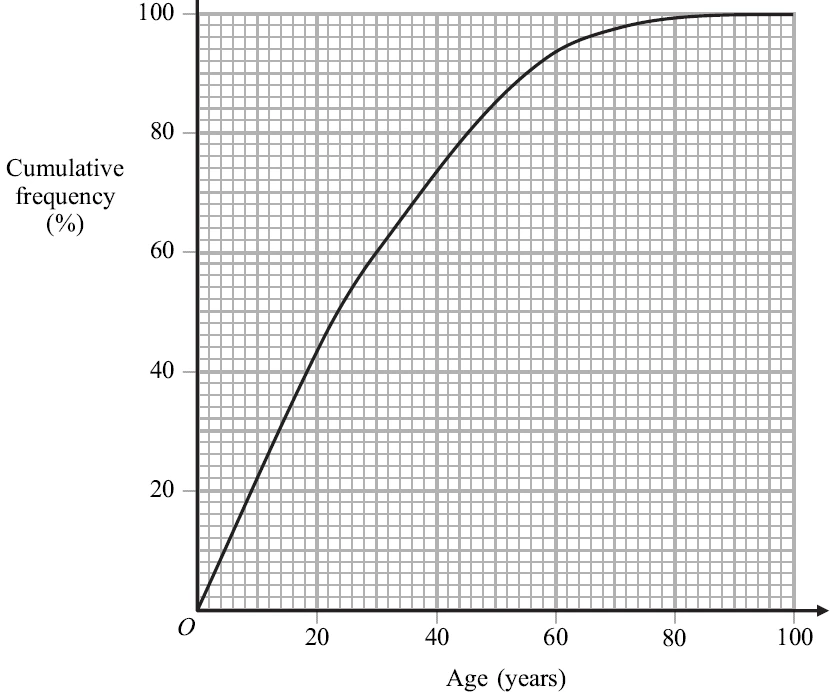
(a) Use the cumulative frequency graph to find an estimate for the percentage of people in India who are
(i) aged less than 20,
(ii) aged 54 or over. (2)
(b) Find an estimate for the interquartile range of the ages of people in India. (2)
| Scheme | Marks |
|---|---|
| (i) 42 – 44 | B1 |
| (ii) 10 – 12 | B1 |
| (2) |
| Scheme | Marks |
|---|---|
| UQ = 41 – 43 \(\quad\) LQ = 10 – 12 | M1 |
| 28 – 33 | A1 |
| (2) | |
| (4 marks) |
Notes
M1: for reading at 25 and 75 stated or cfs of 25 and 75 indicated on graph