
4400 Higher June 2006 Paper 4 Q11
11 A sample of 40 stones was collected.
The cumulative frequency graph gives information about their masses.
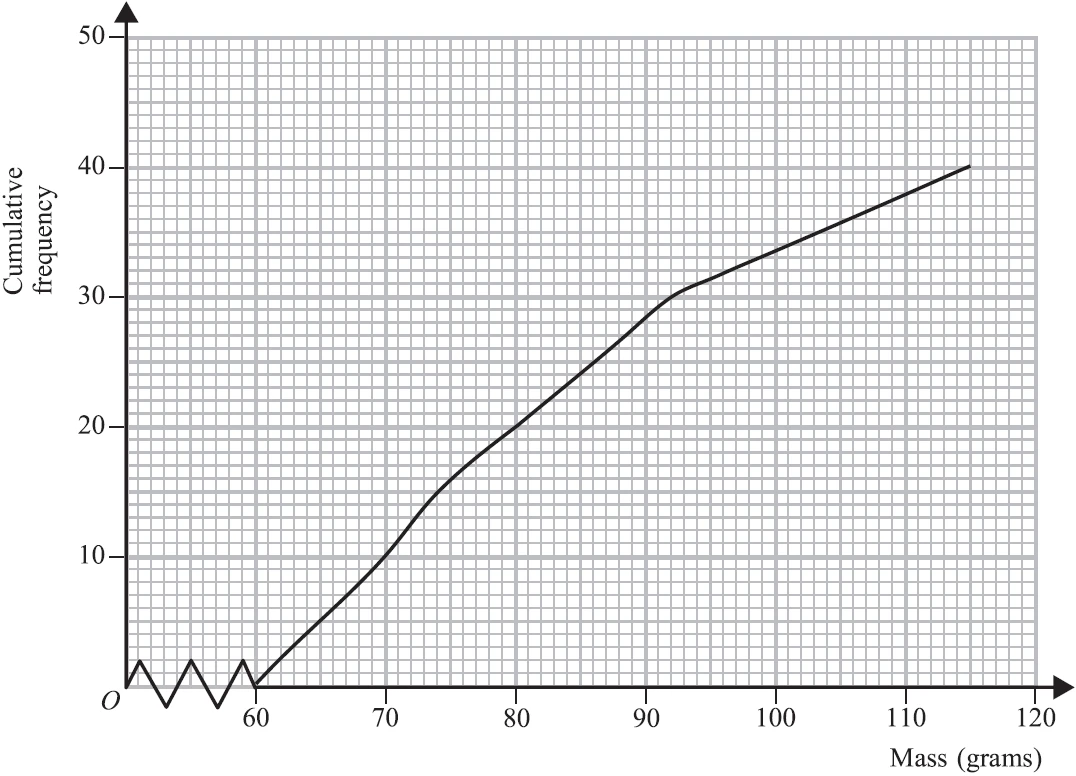
(a) Find an estimate of the median mass. (1)
(b) Find an estimate of the interquartile range of the masses. (2)
(c) How many stones had masses between the lower quartile and the upper quartile? (1)
(d) Find an estimate of the number of stones which had masses of more than 100 grams. (2)
| Scheme | Marks |
|---|---|
| 80 to 81 incl | B1 |
| (1) |
Notes
Consistent use of total = 50 in (abc): (a) B0
| Scheme | Marks |
|---|---|
| Read graph at 70(±1) & 92 – 94 eg marks on curve or \(x\)-axis | M1 |
| 21 – 24 | A1 |
| (2) |
Notes
Consistent use of total = 50: Read at 72(±1) & 109–111: M1A0
| Scheme | Marks |
|---|---|
| 20 cao | B1 |
| (1) |
Notes
Consistent use of total = 50: 25 cao: B1
| Scheme | Marks |
|---|---|
| Read graph at 100 (±1) | M1 |
| 6 or 7 | A1 |
| (2) | |
| (6 marks) |
Notes
M1: eg 34(±1) seen