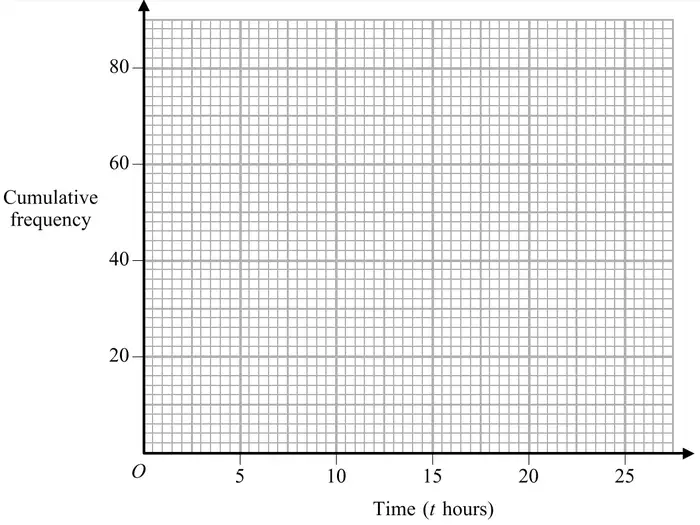
16 The grouped frequency table gives information about the time spent on the Internet last week by each of 80 students.
Time (\(t\) hours)
Frequency
\(0 \lt t \leqslant 5\)
28
\(5 \lt t \leqslant 10\)
22
\(10 \lt t \leqslant 15\)
14
\(15 \lt t \leqslant 20\)
10
\(20 \lt t \leqslant 25\)
6
(a) Complete the cumulative frequency table.
Time (\(t\) hours)
Cumulative frequency
\(0 \lt t \leqslant 5\)
\(0 \lt t \leqslant 10\)
\(0 \lt t \leqslant 15\)
\(0 \lt t \leqslant 20\)
\(0 \lt t \leqslant 25\)
(1)
(b) On the grid, draw the cumulative frequency graph for your table.(2)
(c) Use your graph to find an estimate for the number of students who spent more than 17 hours on the Internet last week. Show your method clearly. (2)
Mark scheme (a)
Scheme
Marks
28, 50, 64, 74, 80
B1
(1)
Notes
B1: cao
Mark scheme (b)
Scheme
Marks
Points
B1
Curve or line segments
B1
(2)
Notes
B1: In (b) incr’ing y’s nec’y. Not blocks end pts ± ½ square ft from sensible table condone one error
B1: dep end pts or midpts thro’ pts ± ½ square; dep on 4 pts correct or ft ignore \(x \lt 5\)
Mark scheme (c)
Scheme
Marks
cf for time of 17h found from graph
M1
~12
A1ft
(2)
(5 marks)
Notes
M1: In (c) incr’ing cf graph essential eg line, mark on graph