
4MA0 Higher January 2017 Paper 3 Q11
11 The frequency table gives information about the lengths of time 100 people spent in a coffee shop.
| Time (\(t\) minutes) | Frequency |
|---|---|
| \(0 \lt t \leqslant 20\) | 4 |
| \(20 \lt t \leqslant 40\) | 12 |
| \(40 \lt t \leqslant 60\) | 26 |
| \(60 \lt t \leqslant 80\) | 42 |
| \(80 \lt t \leqslant 100\) | 12 |
| \(100 \lt t \leqslant 120\) | 4 |
(a) Complete the cumulative frequency table. (1)
| Time (\(t\) minutes) | Cumulative frequency |
|---|---|
| \(0 \lt t \leqslant 20\) | |
| \(0 \lt t \leqslant 40\) | |
| \(0 \lt t \leqslant 60\) | |
| \(0 \lt t \leqslant 80\) | |
| \(0 \lt t \leqslant 100\) | |
| \(0 \lt t \leqslant 120\) |
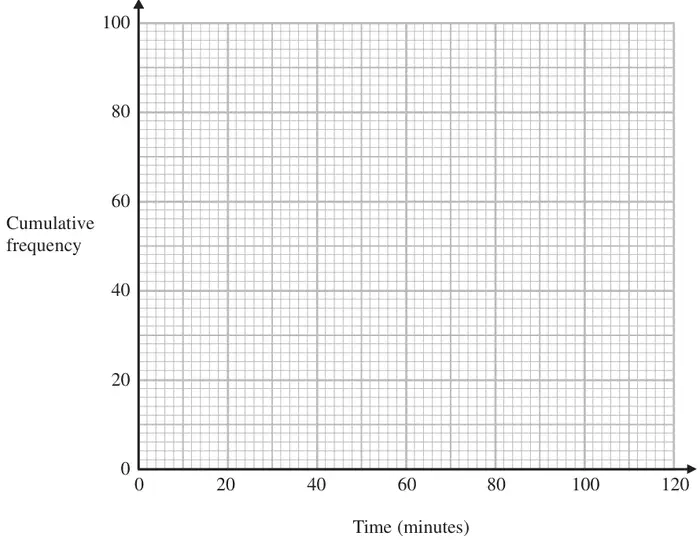
(b) On the grid, draw a cumulative frequency graph for your table. (2)
(c) Use your graph to find an estimate for the lower quartile. (1)
(d) Use your graph to find an estimate for the number of these people who spent longer than 70 minutes in the coffee shop. (2)
| Scheme | Marks |
|---|---|
| 4, 16, 42, 84, 96, 100 Answer: 4, 16, 42, 84, 96, 100 | B1 |
| (1) |
Notes
B1: cao
| Scheme | Marks |
|---|---|
| (20, 4) (40, 16) (60, 42) (80, 84) (100, 96) (120, 100) | M1 |
| correct cf graph | A1 |
| (2) |
Notes
M1: (ft from sensible table i.e. clear attempt at addition)
for at least 4 points plotted correctly at end of interval
or
for all 6 points plotted consistently within each interval in the freq table at the correct height
A1: accept curve or line segments
accept curve that is not joined to (0,0)
| Scheme | Marks |
|---|---|
| 46 - 48 | B1 |
| (1) |
Notes
B1: ft from a cumulative frequency graph
| Scheme | Marks |
|---|---|
| E.g. reading from graph at \(t = 70\) | M1 |
| 36 – 38 | A1 |
| (2) | |
| (6 marks) |
Notes
M1: for evidence of using graph at \(t = 70\)
ft from a cumulative frequency graph provided method is shown
A1: 100 – ‘63’ ft from a cf graph
ft from a cumulative frequency graph provided method is shown