
4MA0 Higher January 2017 Paper 3R Q12
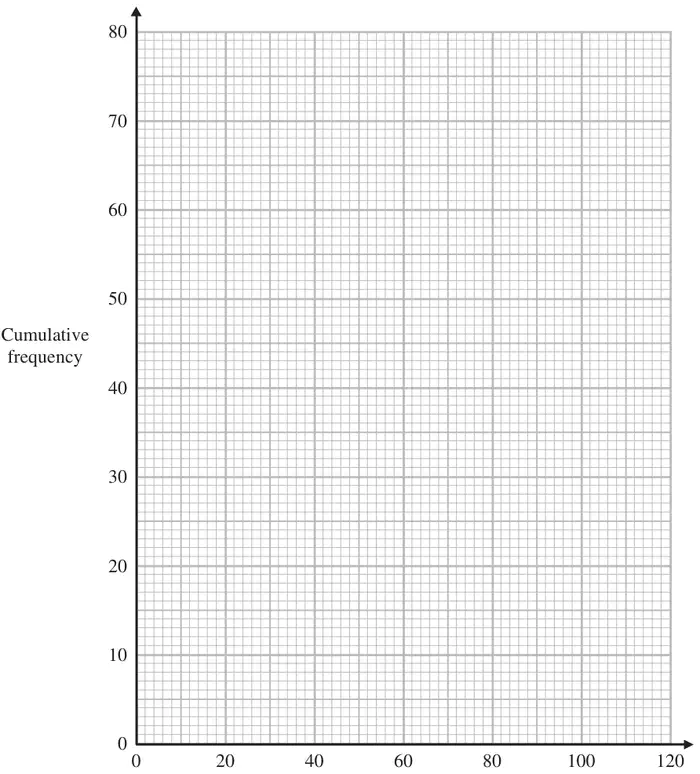
12 The cumulative frequency table shows information about the times, in minutes, 80 people waited at an airport.
| Time (\(t\) minutes) | Cumulative frequency |
|---|---|
| \(0 \lt t \leqslant 20\) | 5 |
| \(0 \lt t \leqslant 40\) | 18 |
| \(0 \lt t \leqslant 60\) | 42 |
| \(0 \lt t \leqslant 80\) | 66 |
| \(0 \lt t \leqslant 100\) | 78 |
| \(0 \lt t \leqslant 120\) | 80 |
(a) On the grid opposite, draw a cumulative frequency graph for the table. (2)
(b) Use your graph to find an estimate for the median time. (2)
(c) Use your graph to find an estimate for the number of these people who waited more than \(1\dfrac{1}{2}\) hours at the airport. (2)
| Scheme | Marks |
|---|---|
| correct graph | B2 |
| (2) |
Notes
B2: Points at end of intervals and joined with curve or line segments
If not B2 then B1 for 5 or 6 of their points from table plotted consistently within each interval at their correct heights and joined with smooth curve or line segments
| Scheme | Marks |
|---|---|
| M1 ft | |
| 57 – 59 | A1 ft |
| (2) |
Notes
M1 ft: for a cf graph horizontal line or mark drawn at 40 or 40.5 or vertical line at correct place, ft their cf graph
A1 ft: from their cf graph
| Scheme | Marks |
|---|---|
| M1ft | |
| 8 | A1ft |
| (2) | |
| (6 marks) |
Notes
M1ft: for reading from cf axis ft their graph from 90 on time axis or 72 ft