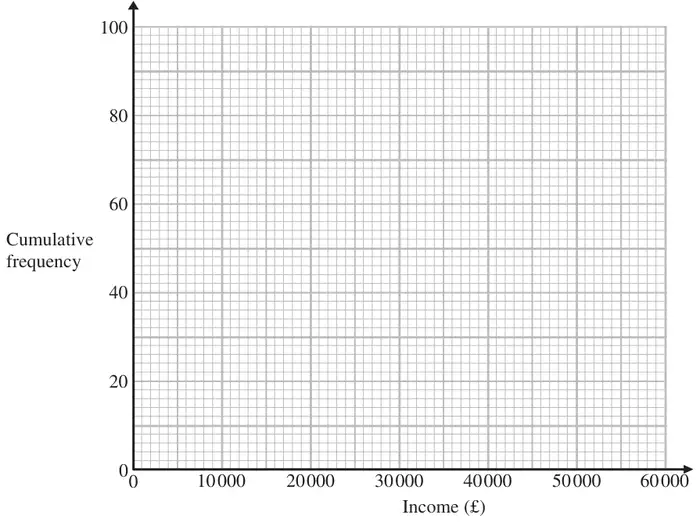
12 The table gives some information about the incomes, £\(I\), of 100 people in the UK.
Income (£\(I\))
Frequency
\(0 \lt I \leqslant 10000\)
12
\(10000 \lt I \leqslant 20000\)
41
\(20000 \lt I \leqslant 30000\)
25
\(30000 \lt I \leqslant 40000\)
12
\(40000 \lt I \leqslant 50000\)
6
\(50000 \lt I \leqslant 60000\)
4
(a) Complete the cumulative frequency table.
Income (£\(I\))
Cumulative frequency
\(0 \lt I \leqslant 10000\)
12
\(0 \lt I \leqslant 20000\)
\(0 \lt I \leqslant 30000\)
\(0 \lt I \leqslant 40000\)
\(0 \lt I \leqslant 50000\)
\(0 \lt I \leqslant 60000\)
(1)
(b) On the grid, draw a cumulative frequency graph for your table.(2)
(c) Use your graph to find an estimate for
(i) the median,
(ii) the interquartile range.
(3)
Mark scheme (a)
Scheme
Marks
12, 53, 78, 90, 96, 100 Correct table
B1
(1)
Mark scheme (b)
Scheme
Marks
Correct cumulative frequency graph
B2
(2)
Notes
B2: fully correct cf graph – points at ends of intervals and joined with curve or line segments If not B2 then B1(ft from a table with only one arithmetic error) for 4 or 5 of their points from table plotted consistently within each interval at their correct heights and joined with smooth curve or line segments
Mark scheme (c)
Scheme
Marks
(i) Answer: 18000-20000
B1 ft
(ii)
M1ft
13000 – 17000
A1ft
(3)
Notes
B1 ft: from their cumulative frequency graph
M1ft: For use of 25 and 75, or 25.25 and 75.75, or 28000(27000-29000) and 13000 (12000 – 14000) stated or indicated on graph. Ft from a cf graph provided method is shown.