
4MA0 Higher January 2016 Paper 3R Q14
14 The cumulative frequency table shows information about the times taken by 92 runners to complete a marathon.
| Time (\(t\) minutes) | Cumulative frequency |
|---|---|
| \(160 \lt t \leqslant 180\) | 9 |
| \(160 \lt t \leqslant 200\) | 35 |
| \(160 \lt t \leqslant 220\) | 68 |
| \(160 \lt t \leqslant 240\) | 80 |
| \(160 \lt t \leqslant 260\) | 89 |
| \(160 \lt t \leqslant 280\) | 92 |
(a) On the grid, draw a cumulative frequency graph for the information in the table. (2)
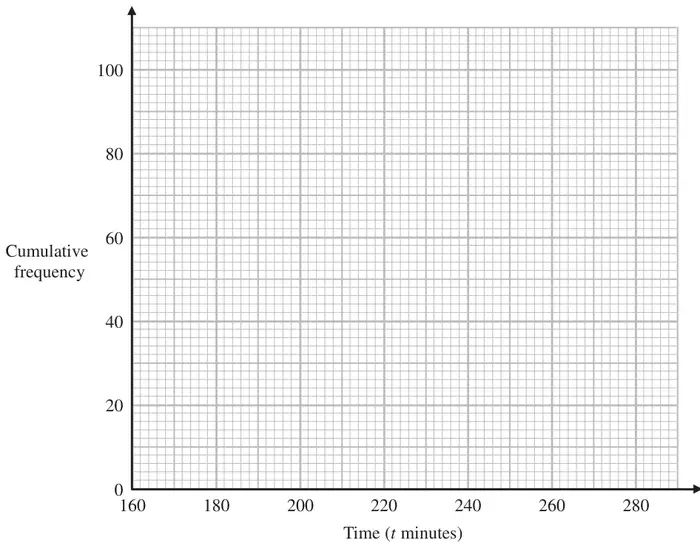
(b) Use the graph to find an estimate for the number of runners who took more than 230 minutes to complete the marathon. (2)
| Scheme | Marks |
|---|---|
| Correct points | B1 |
| Curve or line segments through points | B1 |
| (2) |
Notes
B1: \(\pm\tfrac{1}{2}\) square
B1: ft from points:
if at least 4 are correctly plotted or
if all points are plotted at the correct height consistently within each interval.
Do not penalise omission of curve for \(t \lt 180\)
| Scheme | Marks |
|---|---|
| 74 (approx) corresponding to \(t = 230\) | M1 |
| 92 – 74 = 18 (approx) Answer: 18 (approx) | A1 |
| (2) |
Notes
M1: A reading that is clearly intended to correspond to \(t = 230\) on a cumulative frequency graph.
A1: For correctly subtracting an accurate reading from 92 (allow \(\pm\tfrac{1}{2}\) square for 230 and the reading).
If M1 scored, ft from cf graph
If no indication of method, ft only from a correct curve.