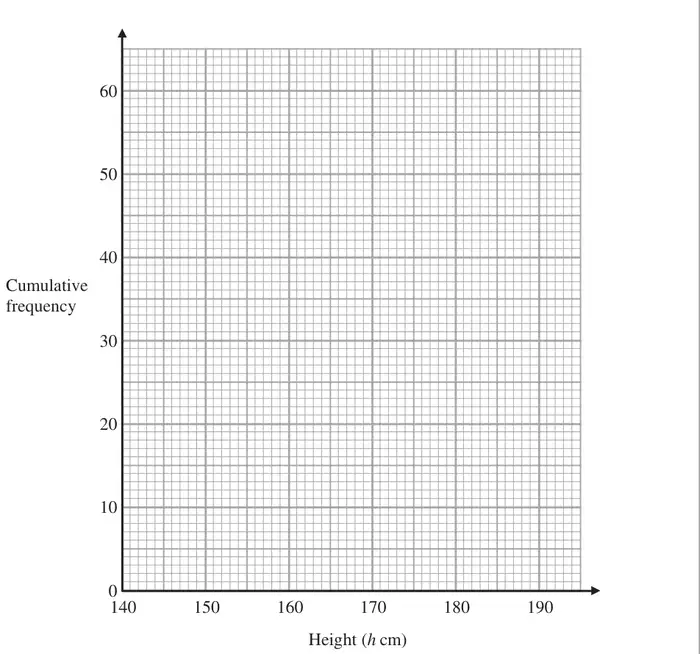
15 The cumulative frequency table shows information about the heights of 60 men.
Height (\(h\) cm)
Cumulative frequency
\(140 \lt h \leqslant 150\)
10
\(140 \lt h \leqslant 160\)
35
\(140 \lt h \leqslant 170\)
52
\(140 \lt h \leqslant 180\)
58
\(140 \lt h \leqslant 190\)
60
(a) On the grid, draw a cumulative frequency graph for the table.(2)
(b) Use your graph to find an estimate for the median height of the 60 men. (2)
(c) Use your graph to find an estimate for the number of the men who are taller than 174 cm. (2)
Mark scheme (a)
Scheme
Marks
Points correct
B1
Curve or line segments joining points
B1
(2)
Notes
B1: \(\pm\tfrac{1}{2}\) square
B1: ft curve/line segments from points if 3 or 4 plotted correctly or if all 5 points are plotted consistently within successive 10 unit intervals at the correct heights.
Mark scheme (b)
Scheme
Marks
30 (or 30.5) indicated on cf graph or stated, or vertical line corresponding to height = 30 (or 30.5) (\(\pm\tfrac{1}{2}\) sq)
M1
157 - 159
A1ft
(2)
Notes
M1: 30 or (30.5) indicated on cf graph or stated.
A1ft: If M1 scored ft from a cf graph If M1 not scored, ft only from correct curve.
Mark scheme (c)
Scheme
Marks
Vertical line or mark drawn at 174 cm or horizontal line corresponding to height = 174 cm (\(\pm\tfrac{1}{2}\) sq)
M1
5 or 6
A1 ft
(2)
Notes
M1: 174 indicated on the cf graph
A1 ft: If M1 scored ft from a cf graph If M1 not scored, ft only from correct curve. Whole number answer only