
4MA0 Higher June 2015 Paper 3R Q12
12 The grouped frequency table gives information about the times recorded for 20 runners in a 1500 metre race.
| Time (\(t\) seconds) | Frequency |
|---|---|
| \(225 \lt t \leqslant 230\) | 1 |
| \(230 \lt t \leqslant 235\) | 3 |
| \(235 \lt t \leqslant 240\) | 7 |
| \(240 \lt t \leqslant 245\) | 6 |
| \(245 \lt t \leqslant 250\) | 2 |
| \(250 \lt t \leqslant 255\) | 1 |
(a) Complete the cumulative frequency table. (1)
| Time (\(t\) seconds) | Cumulative frequency |
|---|---|
| \(225 \lt t \leqslant 230\) | |
| \(225 \lt t \leqslant 235\) | |
| \(225 \lt t \leqslant 240\) | |
| \(225 \lt t \leqslant 245\) | |
| \(225 \lt t \leqslant 250\) | |
| \(225 \lt t \leqslant 255\) |
(b) On the grid, draw the cumulative frequency graph for your table. (2)
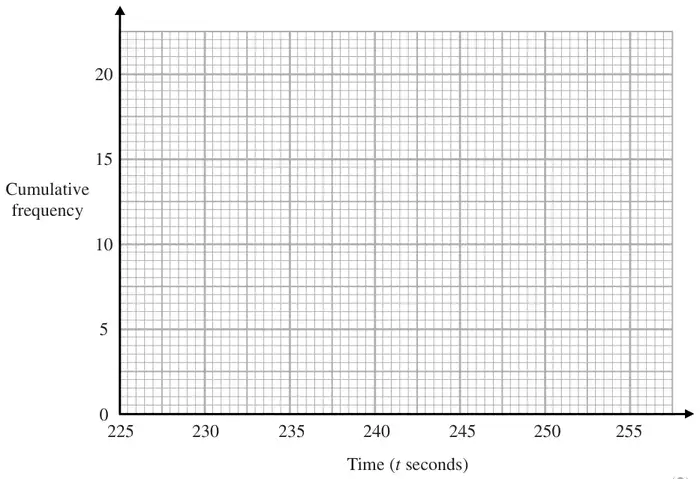
(c) Use your graph to find an estimate for the median of the recorded times. (2)
| Scheme | Marks |
|---|---|
| 1, 4, 11, 17, 19, 20 | B1 |
| (1) |
| Scheme | Marks |
|---|---|
| correct cf graph | B2 |
| (2) |
Notes
B2: Points at end of intervals and joined with curve or line segments
If not B2 then B1 (ft from a table with only one arithmetic error) for 4 or 5 of their points from table plotted consistently within each interval at their correct heights and joined with smooth curve or line segments
| Scheme | Marks |
|---|---|
| M1 | |
| 238.5 – 239.5 | A1 |
| (2) |
Notes
M1: ft for a cf graph horizontal line or mark drawn at 10 or 10.5 or vertical line or mark drawn at 238.5 – 239.5 incl
A1: ft from their cf graph