
4MA0 Higher June 2015 Paper 4 Q10
10 The cumulative frequency graph shows information about the length, in minutes, of each of 80 films.
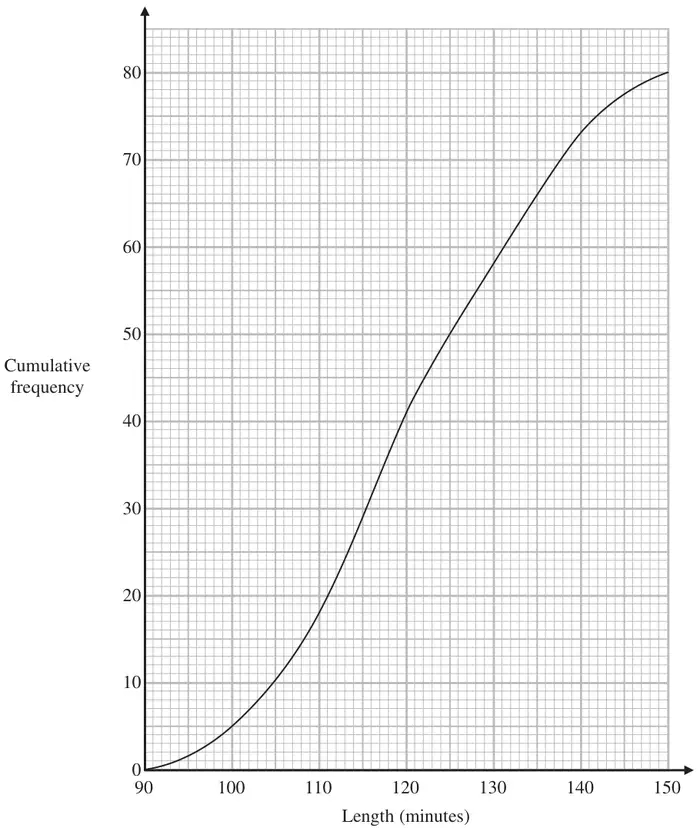
(a) Find an estimate for the interquartile range. (2)
(b) Find an estimate for the percentage of the 80 films that lasted more than 125 minutes. (3)
| Scheme | Marks |
|---|---|
| 131 − 111 | M1 |
| 20 | A1 |
| (2) |
Notes
M1: For 60 & 20 or 60.75 & 20.25 seen in working or in diagram.
A1: Allow answers in the range 20-21 from correct readings.
| Scheme | Marks |
|---|---|
| 80 - 50 (= 30) | M1 |
| \(\dfrac{\text{"}30\text{"}}{80} \times 100\) | M1 |
| 37.5 | A1 |
| (3) |
Notes
M1: or for \(\dfrac{50}{80} \times 100\) (= 62.5)
M1: or for 100 − "62.5"
A1: Accept 38% from correct working