
1MA0 Higher March 2013 Paper 1 Q14
14 The grouped frequency table shows information about the weekly wages of 80 factory workers.
| Weekly wage (£\(x\)) | Frequency |
|---|---|
| \(100 \lt x \leqslant 200\) | 8 |
| \(200 \lt x \leqslant 300\) | 15 |
| \(300 \lt x \leqslant 400\) | 30 |
| \(400 \lt x \leqslant 500\) | 17 |
| \(500 \lt x \leqslant 600\) | 7 |
| \(600 \lt x \leqslant 700\) | 3 |
(a) Complete the cumulative frequency table.
(1)
| Weekly wage (£\(x\)) | Cumulative Frequency |
|---|---|
| \(100 \lt x \leqslant 200\) | |
| \(100 \lt x \leqslant 300\) | |
| \(100 \lt x \leqslant 400\) | |
| \(100 \lt x \leqslant 500\) | |
| \(100 \lt x \leqslant 600\) | |
| \(100 \lt x \leqslant 700\) |
(b) On the grid opposite, draw a cumulative frequency graph for your table. (2)
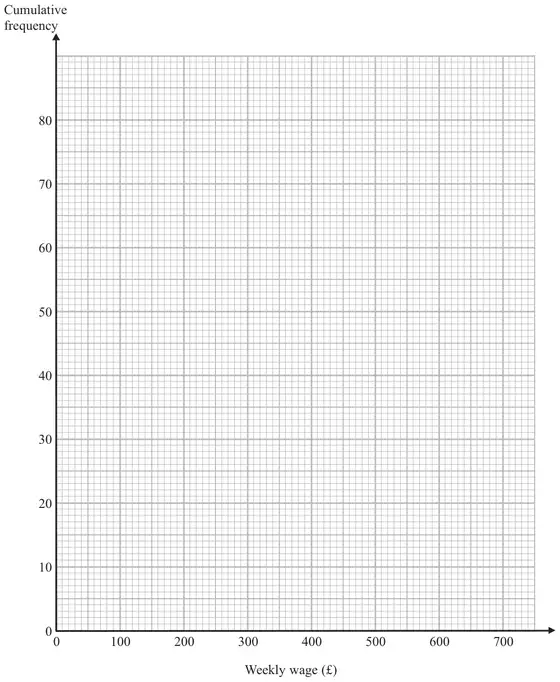
(c) Use your graph to find an estimate for the interquartile range. (2)
(d) Use your graph to find an estimate for the number of workers with a weekly wage of more than £530 (2)
| Answer | Mark | Notes |
|---|---|---|
| 8, 23, 53, 70, 77, 80 | 1 | B1 cao |
| Answer | Mark | Notes |
|---|---|---|
| graph | 2 | M1 ft from their table for at least 5 points plotted correctly at the ends of the intervals provided table values are cumulative, condoning one arithmetic error A1 cao for correct graph with points joined by curve or straight line segments [SC B1 if the shape of the graph is correct and 5 points of their points are not at the ends but consistently within each interval and joined.] |
| Working | Answer | Mark | Notes |
|---|---|---|---|
| Readings at 60 and 20 420 to 440 – 280 to 295 | 120 – 160 | 2 | M1 (dep on cf graph) for use of either cf = 20 or cf = 60 A1 ft from a cf graph |
| Working | Answer | Mark | Notes |
|---|---|---|---|
| 80 – 71 to 74 | 6 – 9 | 2 | M1 (dep on cf graph) for evidence of reading off the cf axis from £530 on the wages axis (could be the answer) A1ft for 6 - 9 |