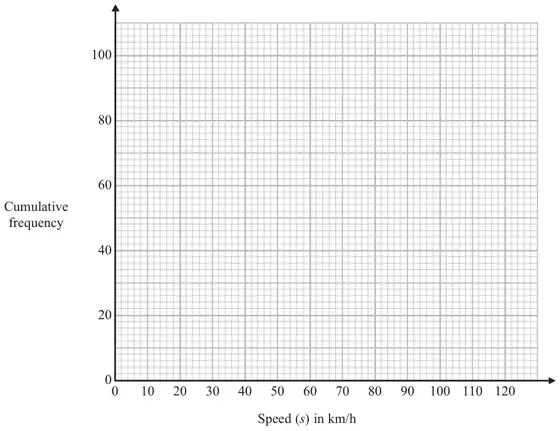
21 The table shows information about the speeds of 100 lorries.
Speed (\(s\)) in km/h
Frequency
\(0 \lt s \leqslant 20\)
2
\(20 \lt s \leqslant 40\)
9
\(40 \lt s \leqslant 60\)
23
\(60 \lt s \leqslant 80\)
31
\(80 \lt s \leqslant 100\)
27
\(100 \lt s \leqslant 120\)
8
(a) Complete the cumulative frequency table for this information.
Speed (\(s\)) in km/h
Cumulative frequency
\(0 \lt s \leqslant 20\)
2
\(0 \lt s \leqslant 40\)
\(0 \lt s \leqslant 60\)
\(0 \lt s \leqslant 80\)
\(0 \lt s \leqslant 100\)
\(0 \lt s \leqslant 120\)
(1)
(b) On the grid, draw a cumulative frequency graph for your table.(2)
(c) Find an estimate for the number of lorries with a speed of more than 90 km/h. (2)
Mark scheme (a)
Answer
Mark
Notes
11, 34, 65, 92, 100
1
B1 cao
Mark scheme (b)
Answer
Mark
Notes
cf graph
2
B1 for 5 or 6 points plotted correctly ±1 full 2 mm square at the upper end of the interval dep on sensible table (condone one error in addition) B1 (dep) for points joined by curve or line segments provided no gradient is negative. Ignore any point or graph outside range of their points. SC B1 for 5 or 6 points plotted not at end but consistently within each interval and joined.
Mark scheme (c)
Answer
Mark
Notes
18 – 24
2
M1 for indication of taking a reading from 90 or ft from their cf graph A1 for 18 – 24