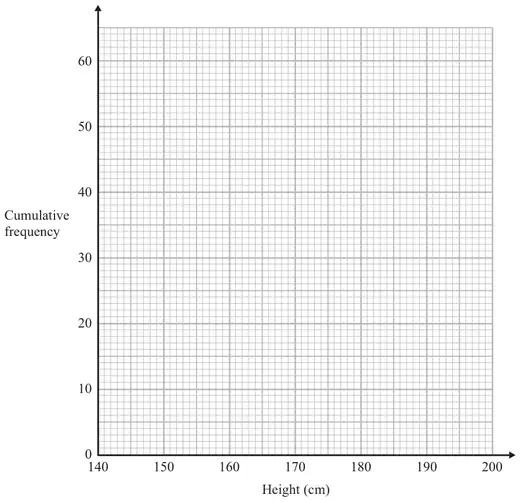
21 The table below shows information about the heights of 60 students.
Height (\(x\) cm)
Number of students
\(140 \lt x \leqslant 150\)
4
\(150 \lt x \leqslant 160\)
5
\(160 \lt x \leqslant 170\)
16
\(170 \lt x \leqslant 180\)
27
\(180 \lt x \leqslant 190\)
5
\(190 \lt x \leqslant 200\)
3
(a) On the grid opposite, draw a cumulative frequency graph for the information in the table.(3)
(b) Find an estimate
(i) for the median,
(ii) for the interquartile range. (3)
Mark scheme (a)
Working
Answer
Mark
Notes
Cf table: 4, 9, 25, 52, 57, 60
Correct Cf graph
3
B1 Correct cumulative frequencies (may be implied by correct heights on the grid) M1 for at least 5 of “6 points” plotted consistently within each interval A1 for a fully correct CF graph
Mark scheme (b)
Working
Answer
Mark
Notes
(i) 172
B1 for 172 or read off at cf = 30 or 30.5 from a cf graph, ft provided M1 is awarded in (a)
IQR = UQ – LQ
(ii) 12 - 14
3
M1 for readings from graph at cf = 15 or 15.25 and cf = 45 or 45.75 from a cf graph with at least one of LQ or UQ correct from graph (± ½ square). A1ft provided M1 is awarded in (a)